# function to compress individual level data into strata level
compress_data = function(df, y, w, x, psbounds = c(0.05, 0.95)){
    df1 = copy(df); setnames(df1, c(y, w), c("y", "w"))
    # this can be replicated using compressed data
    ############################################################
    # strata means and pscores
    estin = df1[,  .(   # mean of treated
                        m1x  = mean(y*w),
                        # mean of controls
                        m0x = mean(y * (1-w)),
                        # treatment share
                        ex  = mean(w),
                        # common variance
                        Var = var(y),
                        # strata size
                        n = .N ),
                        ## BY STRATA
                        by = x][
            # filter out extreme pscores
            ex %between% psbounds][,
            # construct imputed POs (hahn 1998)
            `:=`(Y1 = m1x/ex, Y0 = m0x/(1-ex))][,
            # stratum specific treatment effect
            taux := Y1 - Y0]
    ############################################################
    # conditional variances - also need from compressed data
    condvars = df1[, var(y, na.rm = T), c(x, 'w')]
    condvarswide = dcast(condvars,
            as.formula(glue("{glue_collapse(x, '+' )}~w")),
            value.var = "V1")
    colnames(condvarswide) = c(x, paste0("Var", 0:(ncol(condvarswide) - length(x) - 1)))
    ############################################################
    estin = merge(estin, condvarswide, by = x)
    estin
}


# read in lalonde data
data(lalonde.exp)
df = as.data.table(lalonde.exp)
y = 're78'; w = 'treat'
x = c("black", "nodegree", "u75")
kv = c(y, w, x)
df = df[, ..kv]\(\DeclareMathOperator*{\argmin}{argmin}\) \(\newcommand{\norm}[1]{\left\Vert{#1} \right\Vert}\) \(\newcommand{\var}{\mathrm{Var}}\) \(\newcommand{\tra}{^{\top}}\) \(\newcommand{\sumin}{\sum_{i=1}^n}\) \(\newcommand{\sumiN}{\sum_{i=1}^n}\) \(\newcommand{\epsi}{\varepsilon}\) \(\newcommand{\phii}{\varphi}\) \(\newcommand\Bigpar[1]{\left( #1 \right )}\) \(\newcommand\Bigbr[1]{\left[ #1 \right ]}\) \(\newcommand\Bigcr[1]{\left\{ #1 \right \}}\) \(\newcommand\SetB[1]{\left\{ #1 \right\}}\) \(\newcommand\Sett[1]{\mathcal{#1}}\) \(\newcommand{\Data}{\mathcal{D}}\) \(\newcommand{\E}{\mathbb{E}}\) \(\newcommand{\Ubr}[2]{\underbrace{#1}_{\text{#2}}}\) \(\newcommand{\Obr}[2]{ \overbrace{#1}^{\text{#2}}}\) \(\newcommand{\sumiN}{\sum_{i=1}^N}\) \(\newcommand{\dydx}[2]{\frac{\partial #1}{\partial #2}}\) \(\newcommand\Indic[1]{\mathbb{1}_{#1}}\) \(\newcommand{\Realm}[1]{\mathbb{R}^{#1}}\) \(\newcommand{\Exp}[1]{\mathbb{E}\left[#1\right]}\) \(\newcommand{\Expt}[2]{\mathbb{E}_{#1}\left[#2\right]}\) \(\newcommand{\Var}[1]{\mathbb{V}\left[#1\right]}\) \(\newcommand{\Covar}[1]{\text{Cov}\left[#1\right]}\) \(\newcommand{\Prob}[1]{\mathbf{Pr}\left(#1\right)}\) \(\newcommand{\Supp}[1]{\text{Supp}\left[#1\right]}\) \(\newcommand{\doyx}{\Prob{Y \, |\,\mathsf{do} (X = x)}}\) \(\newcommand{\doo}[1]{\Prob{Y |\,\mathsf{do} (#1) }}\) \(\newcommand{\R}{\mathbb{R}}\) \(\newcommand{\Z}{\mathbb{Z}}\) \(\newcommand{\wh}[1]{\widehat{#1}}\) \(\newcommand{\wt}[1]{\widetilde{#1}}\) \(\newcommand{\wb}[1]{\overline{#1}}\) \(\newcommand\Ol[1]{\overline{#1}}\) \(\newcommand\Ul[1]{\underline{#1}}\) \(\newcommand\Str[1]{#1^{*}}\) \(\newcommand{\F}{\mathsf{F}}\) \(\newcommand{\ff}{\mathsf{f}}\) \(\newcommand{\Cdf}[1]{\mathbb{F}\left(#1\right)}\) \(\newcommand{\Cdff}[2]{\mathbb{F}_{#1}\left(#2\right)}\) \(\newcommand{\Pdf}[1]{\mathsf{f}\left(#1\right)}\) \(\newcommand{\Pdff}[2]{\mathsf{f}_{#1}\left(#2\right)}\) \(\newcommand{\dd}{\mathsf{d}}\) \(\newcommand\Normal[1]{\mathcal{N} \left( #1 \right )}\) \(\newcommand\Unif[1]{\mathsf{U} \left[ #1 \right ]}\) \(\newcommand\Bern[1]{\mathsf{Bernoulli} \left( #1 \right )}\) \(\newcommand\Binom[1]{\mathsf{Bin} \left( #1 \right )}\) \(\newcommand\Pois[1]{\mathsf{Poi} \left( #1 \right )}\) \(\newcommand\BetaD[1]{\mathsf{Beta} \left( #1 \right )}\) \(\newcommand\Diri[1]{\mathsf{Dir} \left( #1 \right )}\) \(\newcommand\Gdist[1]{\mathsf{Gamma} \left( #1 \right )}\) \(\def\mbf#1{\mathbf{#1}}\) \(\def\mrm#1{\mathrm{#1}}\) \(\def\mbi#1{\boldsymbol{#1}}\) \(\def\ve#1{\mbi{#1}}\) \(\def\vee#1{\mathbf{#1}}\) \(\newcommand{\Mat}[1]{\mathbf{#1}}\) \(\newcommand{\eucN}[1]{\norm{#1}}\) \(\newcommand{\lzero}[1]{\norm{#1}_0}\) \(\newcommand{\lone}[1]{\norm{#1}_1}\) \(\newcommand{\ltwo}[1]{\norm{#1}_2}\) \(\newcommand{\pnorm}[1]{\norm{#1}_p}\)
Covariate Adjustment on Compressed Data
Let \(\{Y_i, W_i, X_i\}_{i=1}^N\) be IID draws, where \(W_i \in \{0, 1, \dots, K\}\) is a treatment assignment from a finite set, \(Y_i \in \R\) is a scalar outcome, and \(X_i \in \mathcal{X}\) is a set of discrete covariates. wlog, I focus on the two-treatment case. Throughout, we make the standard assumptions of
- Consistency: \(Y_i = W_i Y^1_i + (1-W_i) Y^0_i\)
- Unconfoundedness: \(Y^1 , Y^0 \bot W | X\)
- Overlap: \(0 < P(W = 1 | X) < 1\)
The AIPW estimator of Hahn (1998) involves fitting three nonparametric regressions:
\[ \wh{\E}[W_i Y_i | X_i = x_i] = \frac{\sum_i W_i Y_i 1(X_i = x_i)}{ \sum_i 1(X_i = x_i)} \]
\[ \wh{\E}[(1-W_i) Y_i | X_i = x_i] = \frac{\sum_i (1-W_i) Y_i 1(X_i = x_i)}{ \sum_i 1(X_i = x_i)} \]
and
\[ \wh{\E}[W_i | X_i = x_i] = \frac{\sum_i W_i 1(X_i = x_i)}{ \sum_i 1(X_i = x_i)} \]
With these estimates to hand, one can then impute potential outcomes in each stratum as
\[ \wh{Y}^1_i = \frac{\wh{\E}[W_i Y_i | X_i]}{\wh{\E}[W_i | X_i]} \]
and
\[ \wh{Y}^0_i = \frac{\wh{\E}[(1-W_i) Y_i | X_i]}{1 - \wh{\E}[W_i | X_i]} \]
and finally average them for the average treatment effect.
\[ \wh{\tau} = n^{-1} \sum_i \wh{Y}^1_i - \wh{Y}^0_i \]
When everything is discrete, Outcome modelling, IPW, and AIPW are the same
(Imbens 2004 pg 18). Via Kevin Chen:
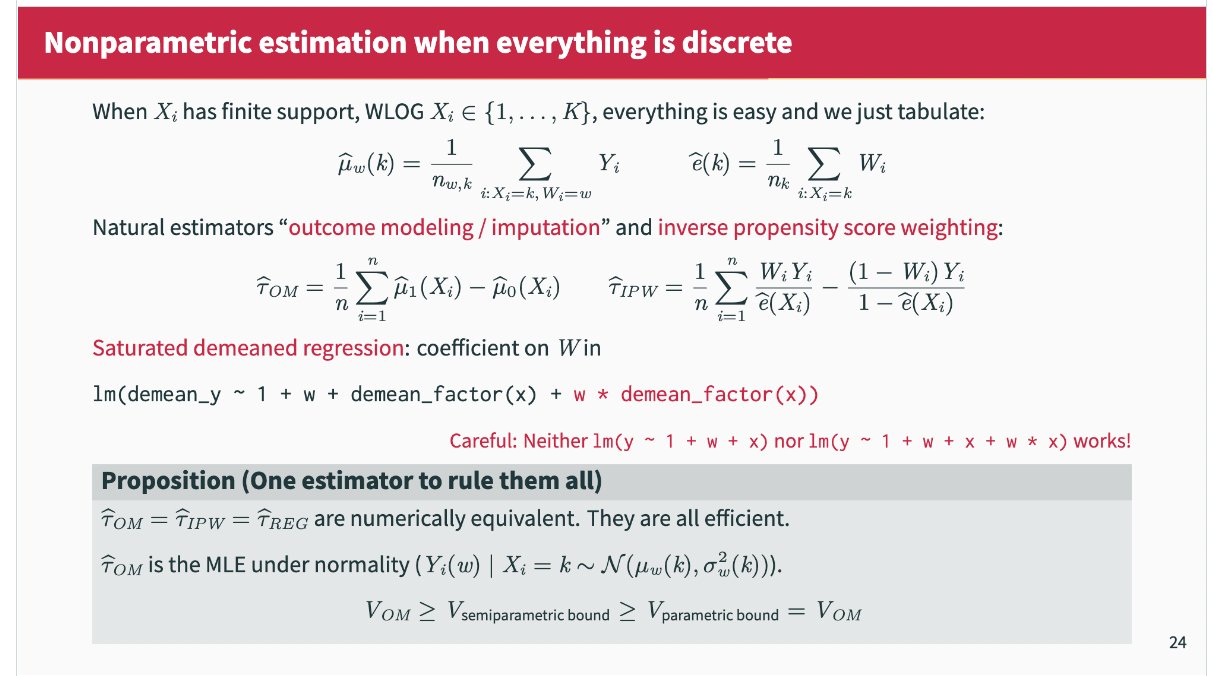
With large datasets, this estimator is extremely appealing, especially since it is completely tuning free and computationally cheap (it can even be implemented in SQL). It also attains the semiparametric efficiency bound.
Lets first compress Lalonde along some discrete covariates.
groupby
d = compress_data(df, y, w, x, psbounds = c(0.05, 0.95))
d
black nodegree u75 m1x m0x ex Var n Y1 Y0 taux Var0
1: 0 0 0 3829 2837 0.6000 36118571 10 6381 7092 -711.0 47856879
2: 0 0 1 4016 5023 0.5556 13864496 9 7229 11302 -4072.5 11403693
3: 0 1 0 2907 4936 0.4211 28397845 19 6905 8525 -1620.4 36075895
4: 0 1 1 2435 3715 0.2778 35385009 36 8766 5144 3621.3 18562406
5: 1 0 0 4236 2096 0.5484 80849116 31 7725 4641 3084.5 49025016
6: 1 0 1 4867 1494 0.5532 55724237 47 8798 3343 5455.4 14200036
7: 1 1 0 3040 2570 0.4479 70770390 96 6787 4655 2131.4 47007672
8: 1 1 1 1550 2544 0.3553 25271962 197 4362 3947 415.5 23426653
Var1
1: 36056634
2: 9962100
3: 19748772
4: 75522910
5: 107193986
6: 77343255
7: 99308107
8: 28895029We have six strata with estimated treatment effects within each, and the ingredients to compute variance within them. This is also a cheap treatment heterogeneity strategy when one has a moderate number of strata induced by discrete covariates.
subcl_hahn = function(estin){
    N = sum(estin$n)
    Vhet = (with(estin, weightedVar(taux, n)) +                    # Var(τ(X)) - across strata
            with(estin, weightedMean(Var1/ex + Var0/(1-ex)), n)    # Var(τ_x)  - within strata
            )
    Vhom = (with(estin, weightedVar(taux, n)) +
            with(estin, weightedMean(Var/(ex*(1-ex)), n))
            )
    # return
    c(tau     = estin[, weightedMean(taux, n)],
      se_hom  = sqrt(Vhom/N),
      se_het  = sqrt(Vhet/N)
    )
}

# se_het might be missing if var(Y_w) is missing for any strata (i.e. only 1 obs
# with treatment status w in stratum X = x. This suggests )

subcl_hahn(d) %>% print
tau se_hom se_het
1560.2 644.5 662.4 Standard Error
subcl_hahn(d) %>% print tau se_hom se_het
1560.2 644.5 662.4 Bootstrap
tic()
out = boot(d,
    \(d, i) subcl_hahn(d[i,]),
    R = 1e4,
    parallel = "multicore", ncpus = 6)
toc()
0.878 sec elapsedout |> print()
ORDINARY NONPARAMETRIC BOOTSTRAP


Call:
boot(data = d, statistic = function(d, i) subcl_hahn(d[i, ]),
    R = 10000, parallel = "multicore", ncpus = 6)


Bootstrap Statistics :
    original  bias    std. error
t1*   1560.2  129.42       795.4
t2*    644.5   56.96       191.5
t3*    662.4   38.25       153.8
The analytic and bootstrap standard errors for the Hahn estimator are in the same ballpark.