R implementation of binned scatterplot and CEF plotter, with added options for cluster variance
binscatter.RdR implementation of binned scatterplot and CEF plotter, with added options for cluster variance
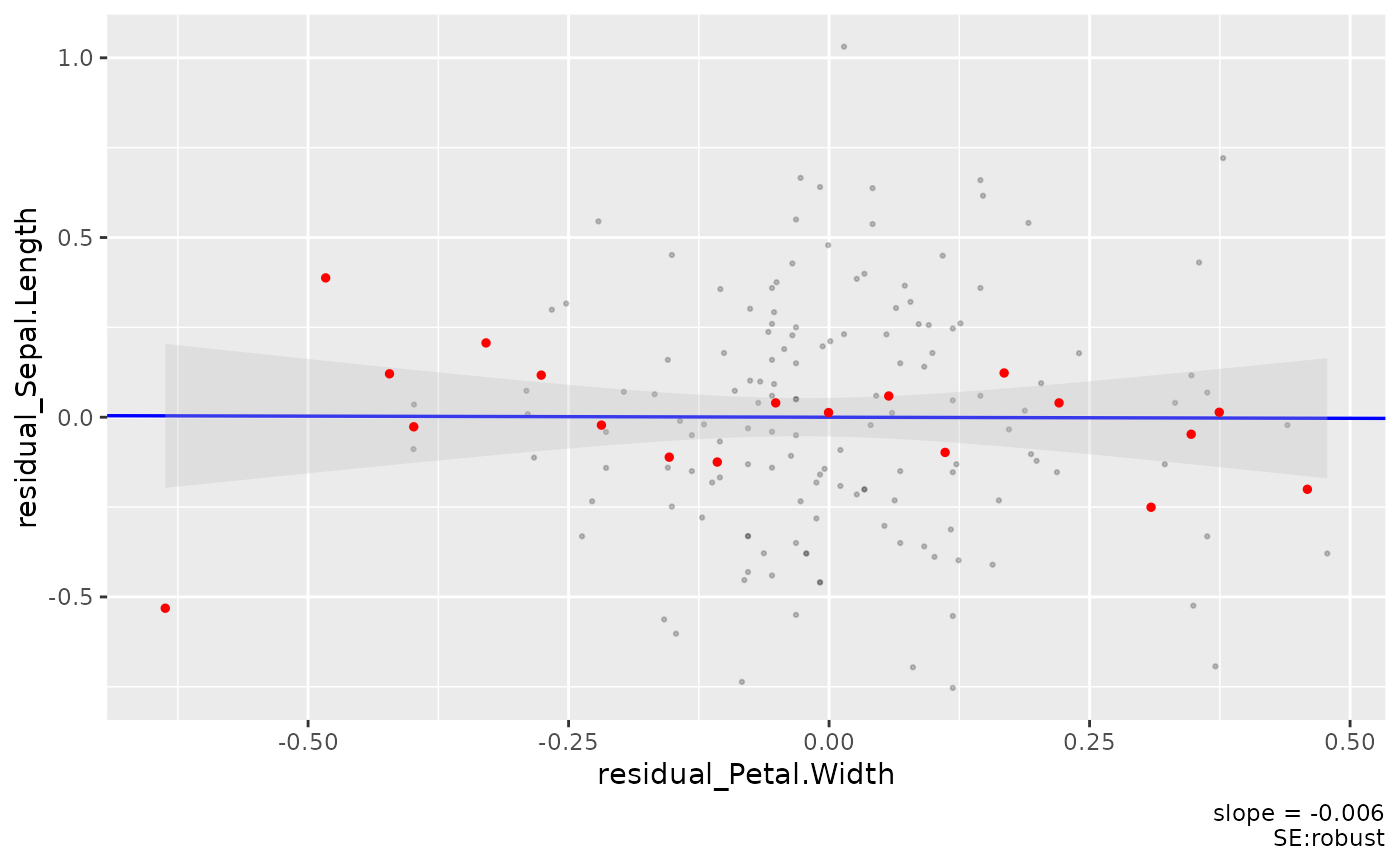
Usage
binscatter(
  fmla,
  key_var,
  data,
  plotraw = TRUE,
  bins = 20,
  rawdata_colour = "black",
  rawdata_alpha = 0.2,
  rawdata_size = 0.5,
  linfit_width = 0.6,
  linfit_colour = "blue",
  cef_point_size = 1,
  cef_point_colour = "red",
  ci_colour = "gray",
  ci_alpha = 0.3
)
Arguments
- fmla
FELM formula *as a string*
- key_var
X axis variable for CEF
- data
dataframe
- plotraw
T if underlying scatterplot should be plotted
- bins
number of bins
- rawdata_colour
Colour of Rawdata
- rawdata_alpha
Alpha of Rawdata
- rawdata_size
Size of Rawdata
- linfit_width
width of linear fit
- linfit_colour
colour of linear fit
- cef_point_size
Size of binscatter points
- cef_point_colour
Colour of binscatter points
- ci_colour
Colour of CI ribbon
- ci_alpha
Alpha of CI ribbon