Spatial Methods in R
Worked examples from Pebesma and Bivand 2019
In [1]:
rm(list = ls())
In [2]:
# install.packages("starsdata", repos = "http://pebesma.staff.ifgi.de", type = "source")
# install.packages("spDataLarge", repos = "https://nowosad.github.io/drat/", type = "source")
In [ ]:
library(LalRUtils)
libreq(lfe, data.table, tidyverse, magrittr, sf,
      stars, mapview, starsdata, spacetime, spDataLarge,
       gstat, tmap, spdep, spatialreg, reticulate,
      xts, units, rnaturalearth, classInt, viridis)
theme_set(lal_plot_theme())
set.seed(42)
In [2]:
root = '/home/alal/tmp/r_spatial'
setwd(root)
Basics
In [6]:
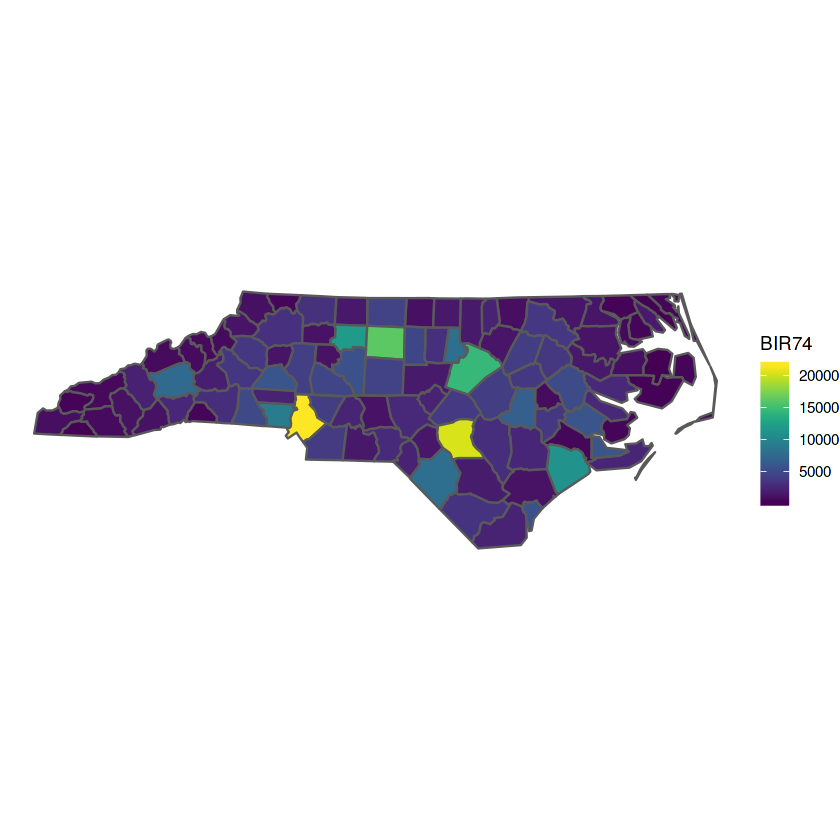
nc = system.file("gpkg/nc.gpkg", package="sf") %>%
    read_sf()
nc %>%
    st_transform(32119) %>%
    select(BIR74) %>%
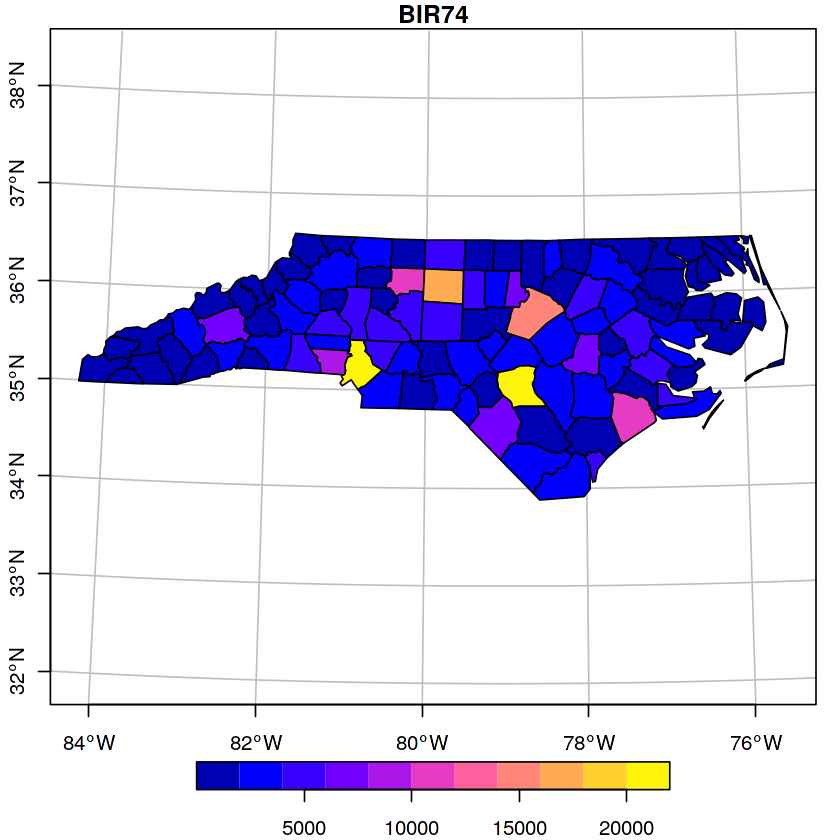
    plot(graticule = TRUE, axes = TRUE)
In [7]:
nc %>%
    st_transform(32119) %>%
    select(BIR74) %>%
    mapview(zcol = "BIR74", legend = TRUE,
            col.regions = sf.colors)
Geometries
Simple Features
In [8]:
(pt = st_point(c(0,1)))
attributes(pt)
In [9]:
system.file("shape/storms_xyz_feature.shp", package="sf") %>%
    st_read()
Raster and Vector Datacubes
In [10]:
tif = system.file("tif/L7_ETMs.tif", package = "stars")
x = read_stars(tif)
In [11]:
x
In [14]:
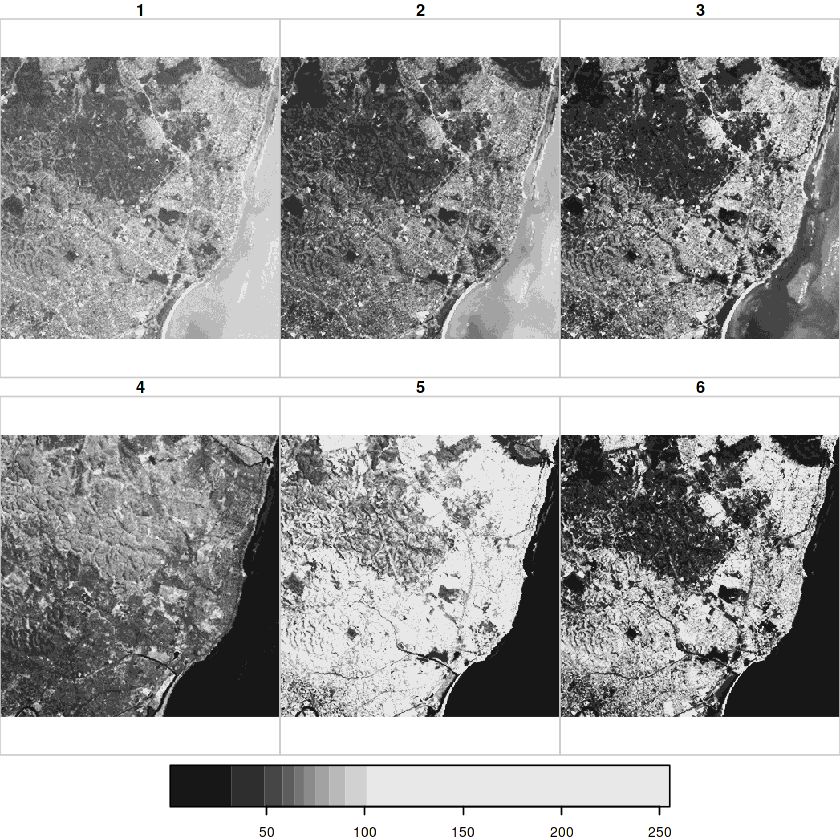
plot(x)
In [15]:
par(mfrow = c(1, 2))
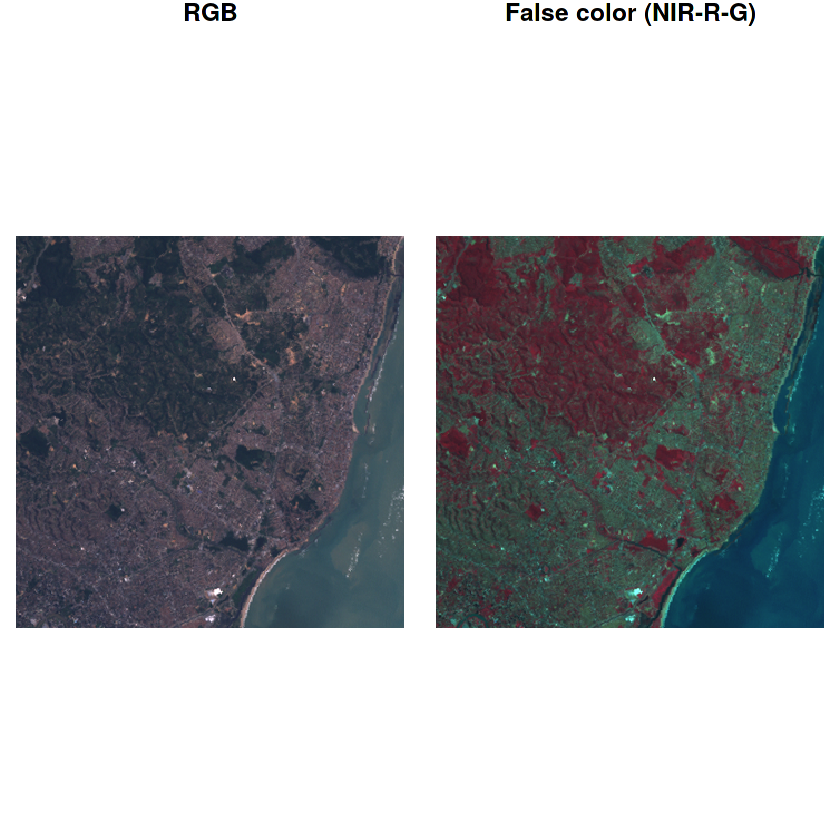
plot(x, rgb = c(3,2,1), reset = FALSE, main = "RGB")    # rgb
plot(x, rgb = c(4,3,2), main = "False color (NIR-R-G)") # false color
In [16]:
log(x)
In [17]:
ndvi = function(x) (x[4]-x[3])/(x[4]+x[3])
st_apply(x, c("x", "y"), ndvi)
Proxy objects
In [19]:
granule = system.file("sentinel/S2A_MSIL1C_20180220T105051_N0206_R051_T32ULE_20180221T134037.zip", package = "starsdata")
file.size(granule)
In [20]:
base_name = strsplit(basename(granule), ".zip")[[1]]
s2 = paste0("SENTINEL2_L1C:/vsizip/", granule, "/", base_name, ".SAFE/MTD_MSIL1C.xml:10m:EPSG_32632")
(p = read_stars(s2, proxy = TRUE))
In [21]:
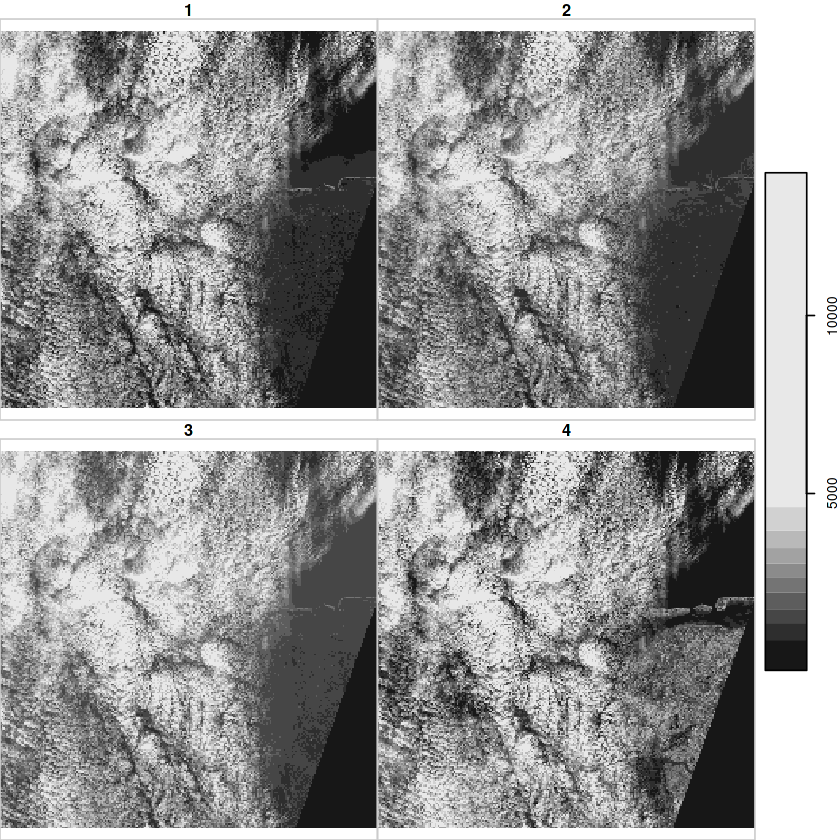
plot(p)
Data Cubes
In [23]:
data(air) # this loads several datasets in .GlobalEnv
dim(air)
In [24]:
d = st_dimensions(station = st_as_sfc(stations), time = dates)
(aq = st_as_stars(list(PM10 = air), dimensions = d))
In [25]:
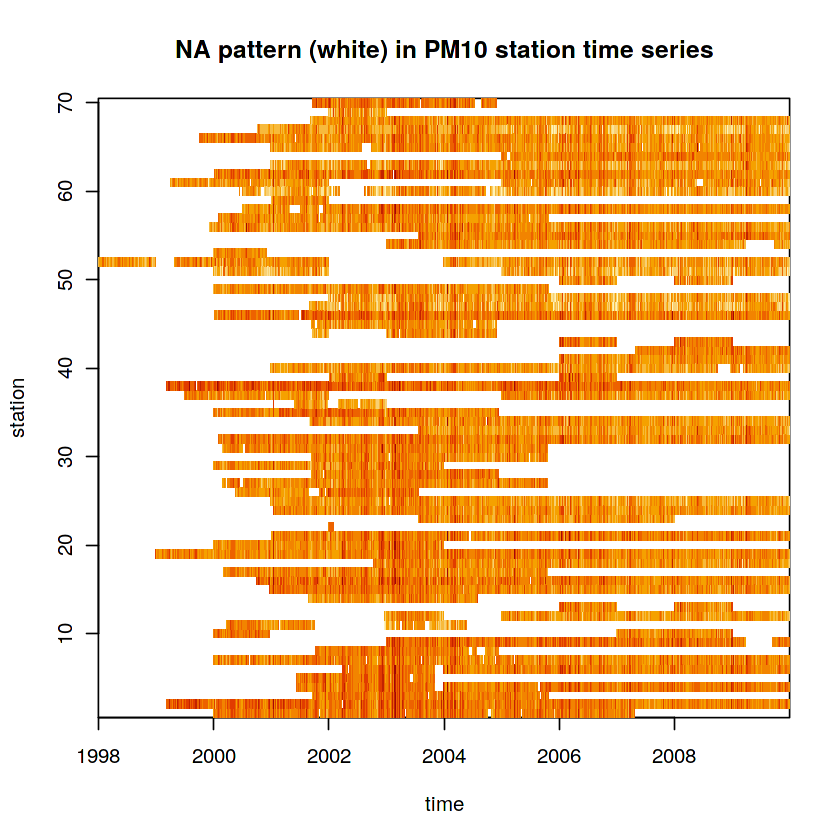
image(aperm(log(aq), 2:1), main = "NA pattern (white) in PM10 station time series")
In [26]:
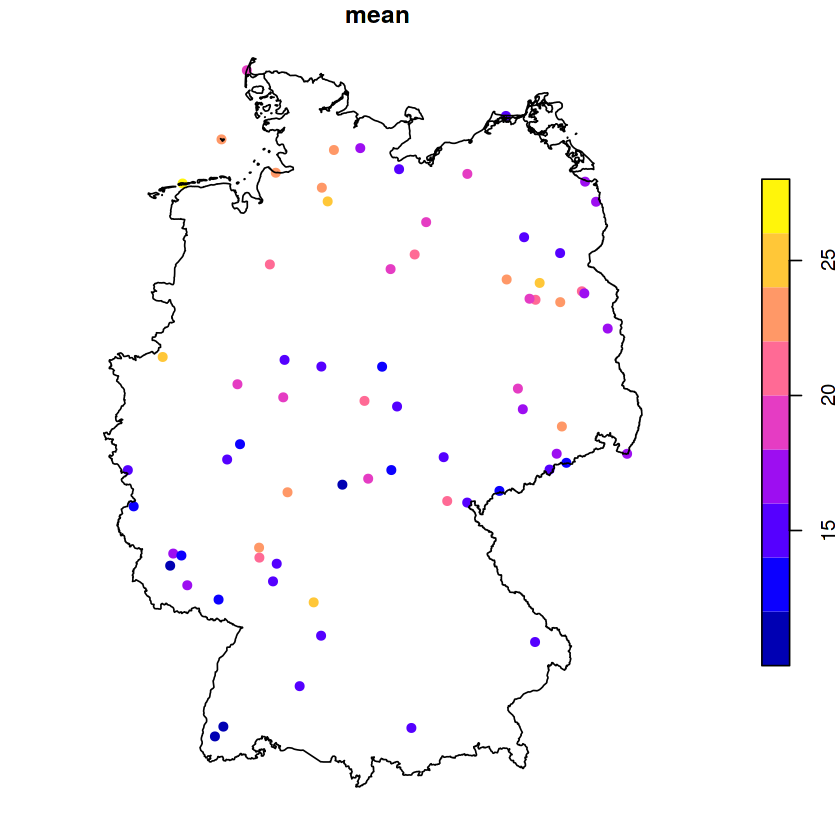
plot(st_as_sf(st_apply(aq, 1, mean, na.rm = TRUE)),
     reset = FALSE, pch = 16,
    ylim = st_bbox(DE)[c(2,4)])
plot(DE, add=TRUE)
In [29]:
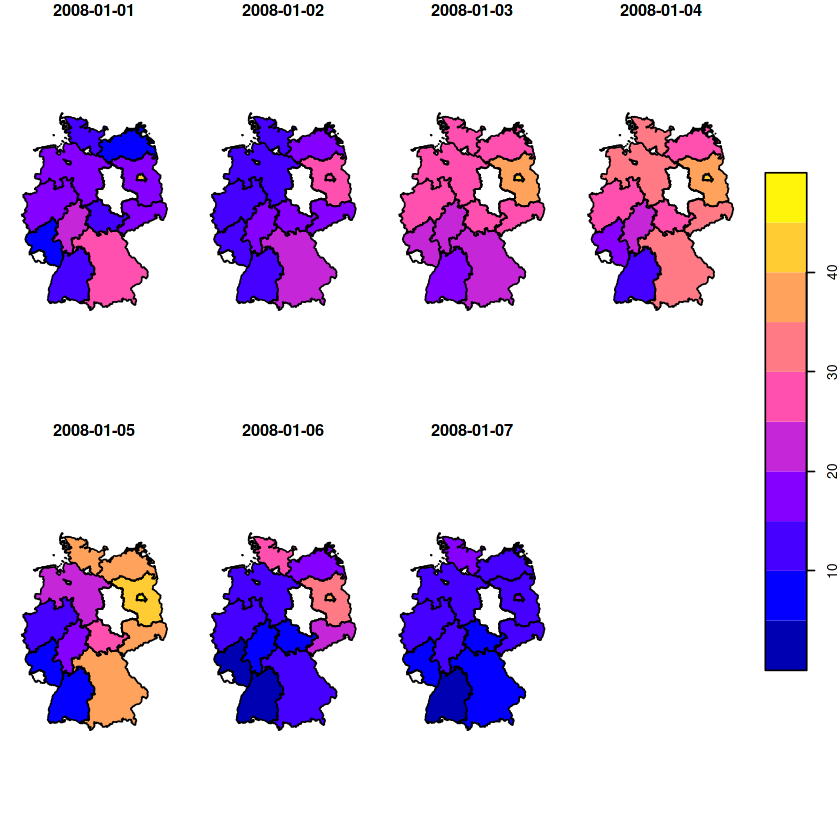
(a = aggregate(aq, st_as_sf(DE_NUTS1), mean, na.rm = TRUE))
a %>% filter(time >= "2008-01-01", time < "2008-01-08") %>% plot(key.pos = 4)
In [30]:
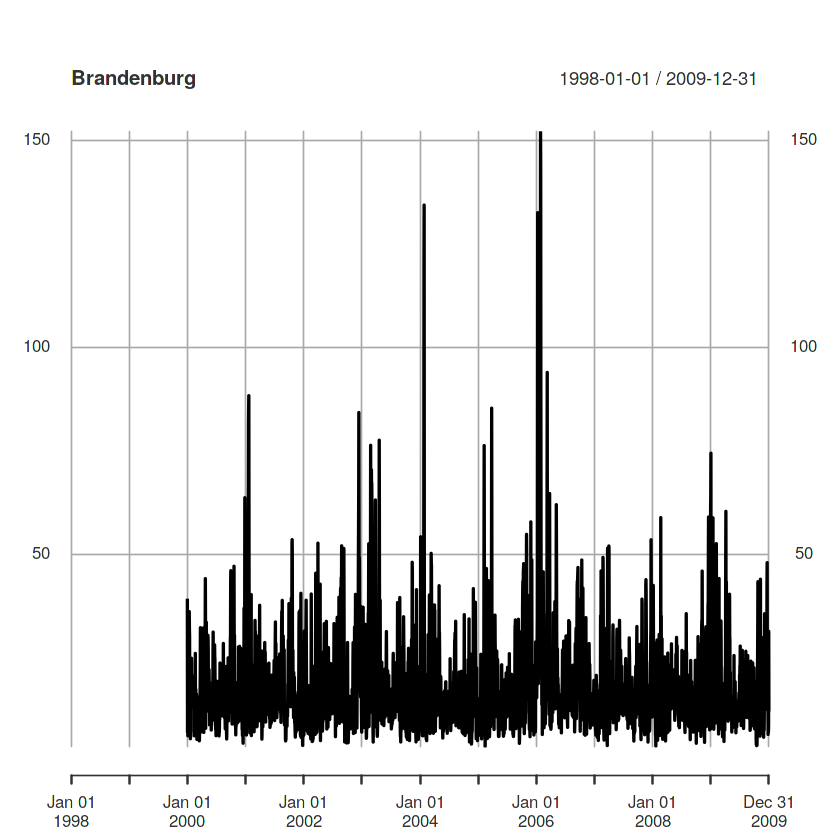
plot(as.xts(a)[,4], main = DE_NUTS1$NAME_1[4])
In [31]:
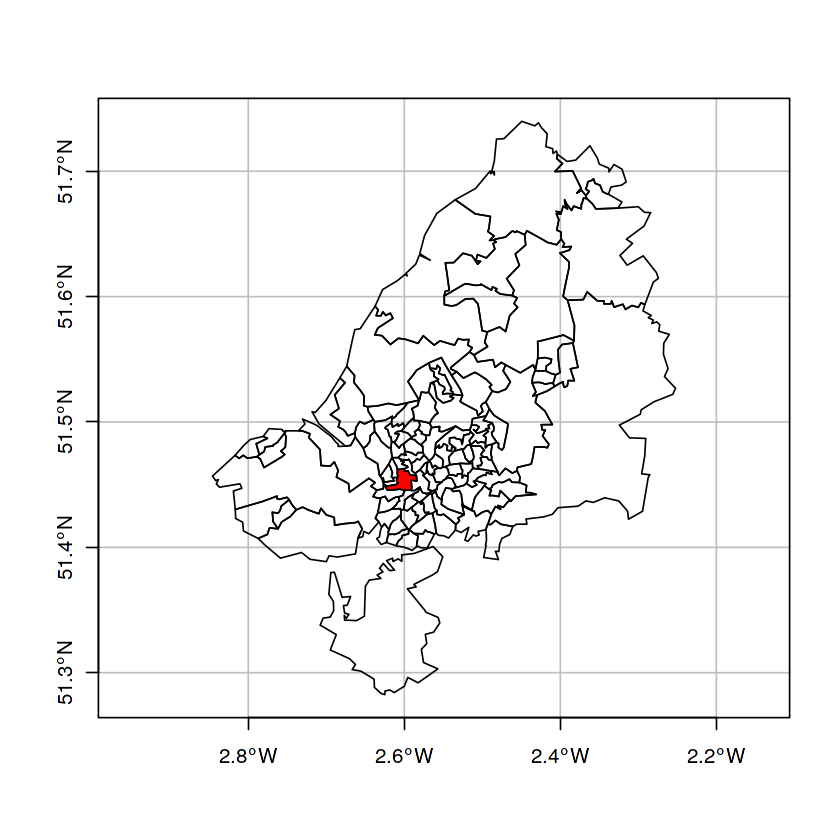
plot(st_geometry(bristol_zones), axes = TRUE, graticule = TRUE)
plot(st_geometry(bristol_zones)[33], col = 'red', add = TRUE)
In [32]:
bristol_od %>% head
In [34]:
bristol_tidy <- bristol_od %>% select(-all) %>% gather("mode", "n", -o, -d)
head(bristol_tidy)
od = bristol_tidy %>% pull("o") %>% unique
Building data cube
In [35]:
nod = length(od)
mode = bristol_tidy %>% pull("mode") %>% unique
nmode = length(mode)
a = array(0L,  c(nod, nod, nmode),
    dimnames = list(o = od, d = od, mode = mode))
a[as.matrix(bristol_tidy[c("o", "d", "mode")])] = bristol_tidy$n
order = match(od, bristol_zones$geo_code) # it happens this equals 1:102
zones = st_geometry(bristol_zones)[order]
(d = st_dimensions(o = zones, d = zones, mode = mode))
In [36]:
(odm = st_as_stars(list(N = a), dimensions = d))
In [37]:
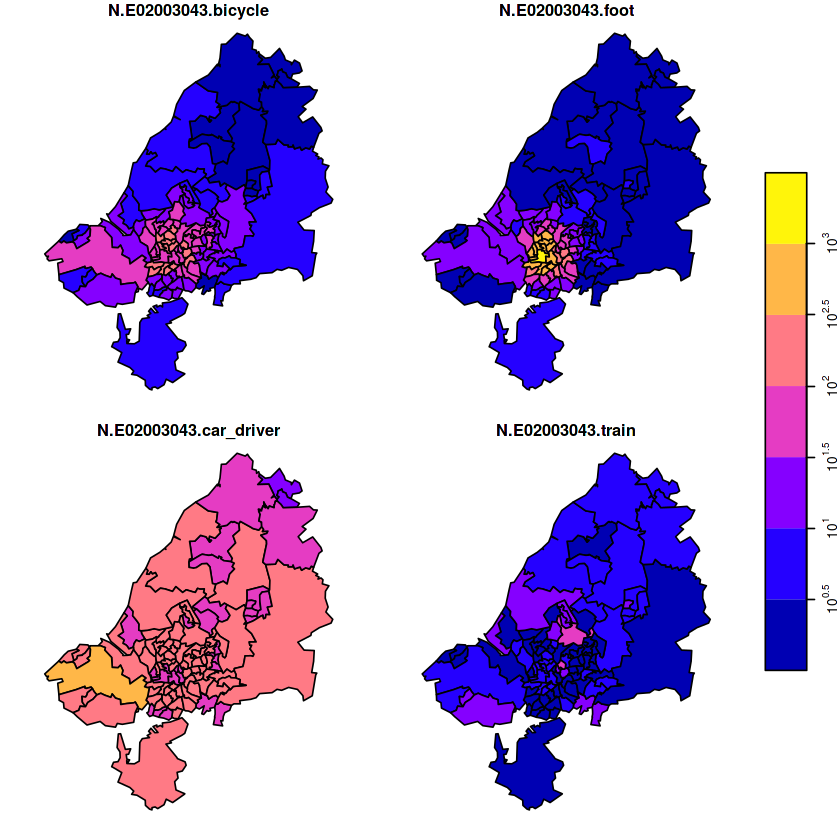
plot(odm[,,33] + 1, logz = TRUE)
Manipulating Geometries
In [39]:
demo(nc, ask = FALSE, echo = FALSE)
In [40]:
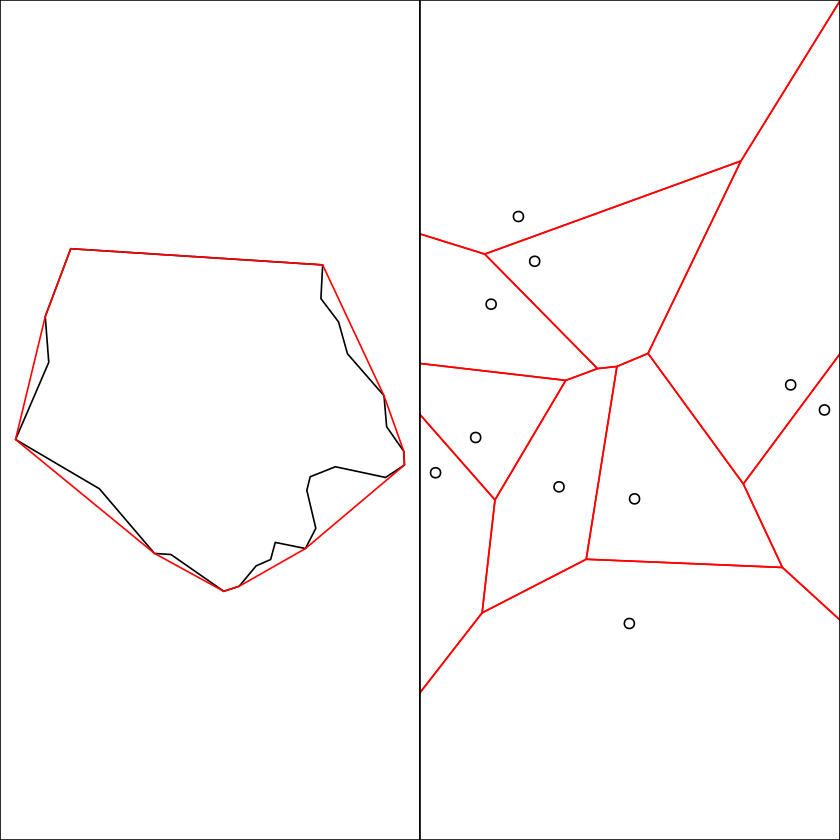
par(mar = rep(0,4), mfrow = c(1, 2))
plot(st_geometry(nc)[1], col = NA, border = 'black')
plot(st_convex_hull(st_geometry(nc)[1]), add = TRUE, col = NA, border = 'red')
box()
set.seed(131)
mp = st_multipoint(matrix(runif(20), 10))
plot(mp)
plot(st_voronoi(mp), add = TRUE, col = NA, border = 'red')
box()
Feature Attributes
In [41]:
system.file("gpkg/nc.gpkg", package="sf") %>%
    read_sf() %>%
    st_transform(32119) %>%
    select(BIR74, SID74, NAME) %>%
    st_centroid() %>%
    head(n = 1) -> x # save as x
In [42]:
nc <- system.file("gpkg/nc.gpkg", package="sf") %>%
    read_sf() %>%
    st_transform(32119)
nc1 <- nc %>% select(BIR74, SID74, NAME) %>%
    st_set_agr(c(BIR74 = "aggregate", SID74 = "aggregate", NAME = "identity"))
Spatial Join
In [43]:
a = st_sf(a = 1:2, geom = st_sfc(st_point(c(0,0)), st_point(c(1,1))))
b = st_sf(b = 3:4, geom = st_sfc(st_linestring(rbind(c(2,0), c(0,2))),
                                 st_point(c(1,1))))
st_join(a, b)
In [44]:
p1 = st_polygon(list(rbind(c(0,0), c(4,0), c(4,4), c(0,4), c(0,0))))
d1 = st_sf(a = c(3,1), geom = st_sfc(p1, p1 + c(4, 0)))
d2 = st_sf(b = c(4), geom = st_sfc(p1 * .75 + c(3, 2)))
In [45]:
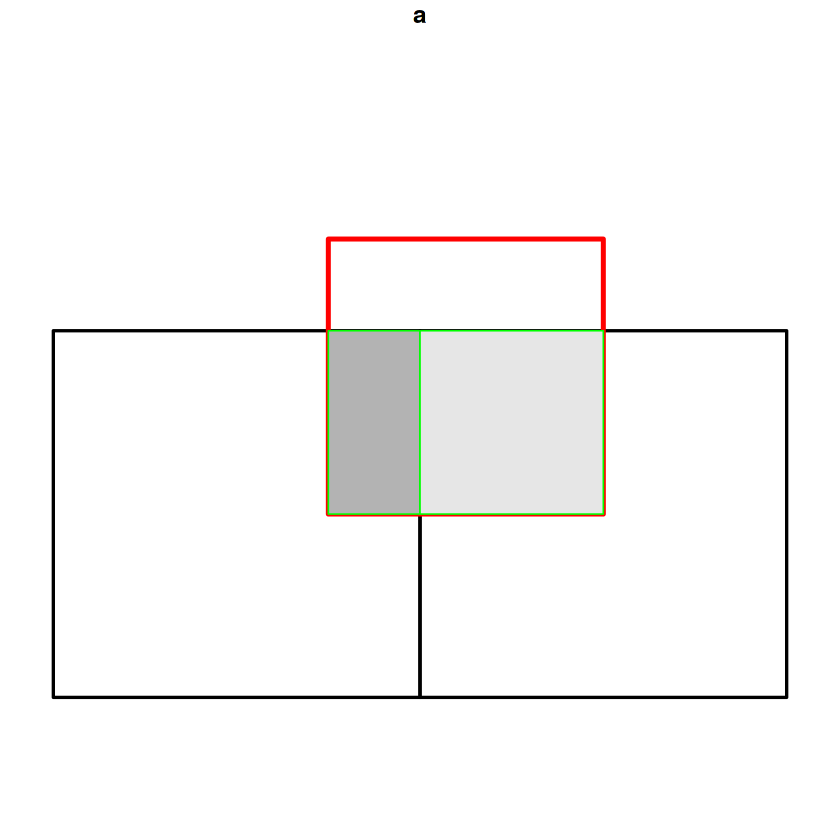
(i = st_intersection(d1, d2))
In [46]:
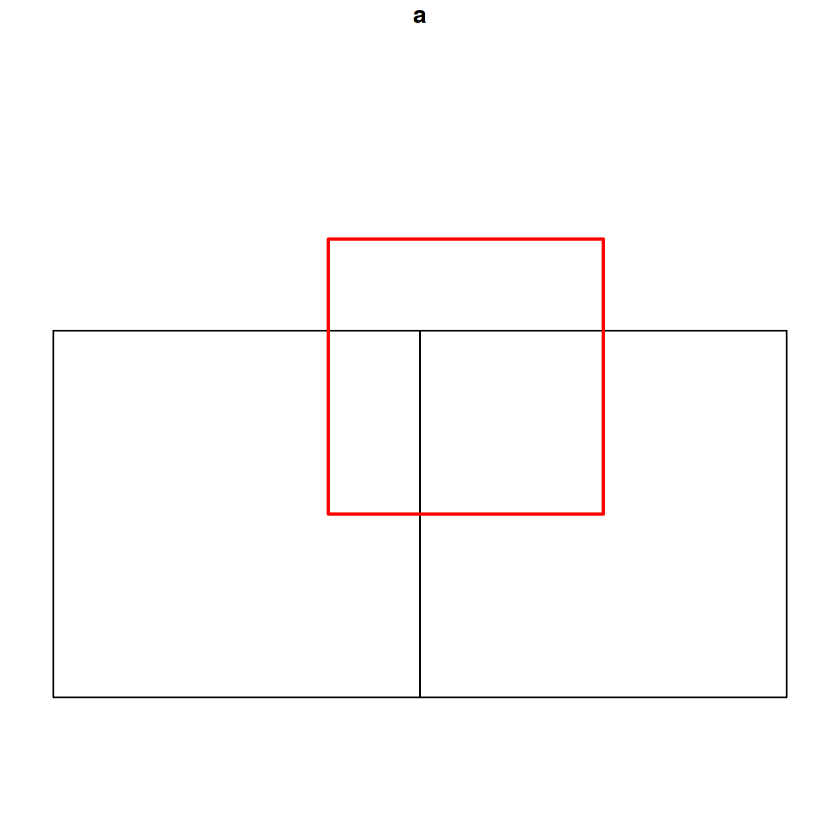
plot(d1, xlim = c(0,8), ylim = c(0, 6), col = NA, border = 1, reset = FALSE)
plot(d2, col = NA, border = 'red', add = TRUE, lwd = 2)
plot(d1, xlim = c(0,8), ylim = c(0, 6), col = NA, border = 1, lwd = 2, reset = FALSE)
plot(d2, col = NA, border = 'red', add = TRUE, lwd = 3)
plot(st_geometry(i), add = TRUE, col = grey(c(.7,.9)), , border = 'green', lwd = 1)
Reference Systems
- a coordinate system is a set of mathematical rules for specifying how coordinates are to be assigned to points
- a datum is a parameter or set of parameters that define the position of the origin, the scale, and the orientation of a coordinate system,
- a geodetic datum is a datum describing the relationship of a two- or three-dimensional coordinate system to the Earth, and
- a coordinate reference system is a coordinate system that is related to an object by a datum; for geodetic and vertical datums, the object will be the Earth.
In [3]:
(a = set_units(1:3, m))
a_km = set_units(1:3, km)
a + a_km
In [4]:
b = set_units(4:6, s)
a / b
In [5]:
(d = as.Date("1970-02-01"))
as.numeric(d)
CRS Class
In [6]:
st_crs(4326)
st_crs("+proj=longlat")
In [10]:
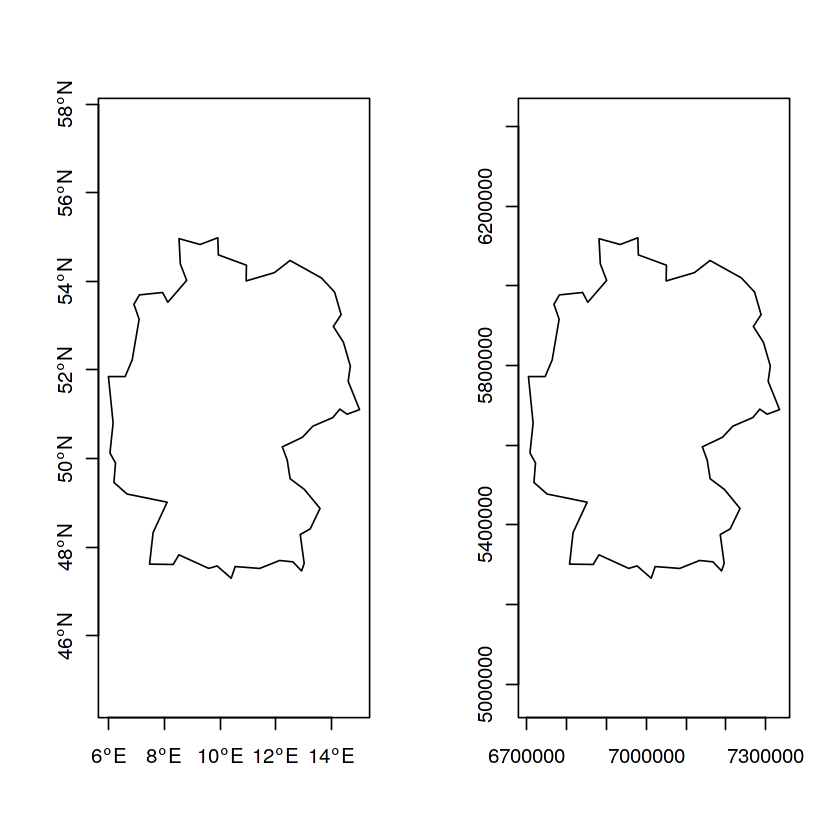
DE = st_geometry(ne_countries(country = "germany", returnclass = "sf"))
DE.eqc = st_transform(DE, "+proj=eqc +lat_ts=51.14 +lon_0=90w")

par(mfrow = c(1, 2))
plot(DE, axes = TRUE)
plot(DE.eqc, axes = TRUE)
In [12]:
r = rnorm(100)
(cI <- classIntervals(r))
In [13]:
(ls = st_sfc(st_linestring(rbind(c(-179.5, 52), c(179.5, 52))), crs = 4326))
st_length(ls)
Base and Grid Plots
In [14]:
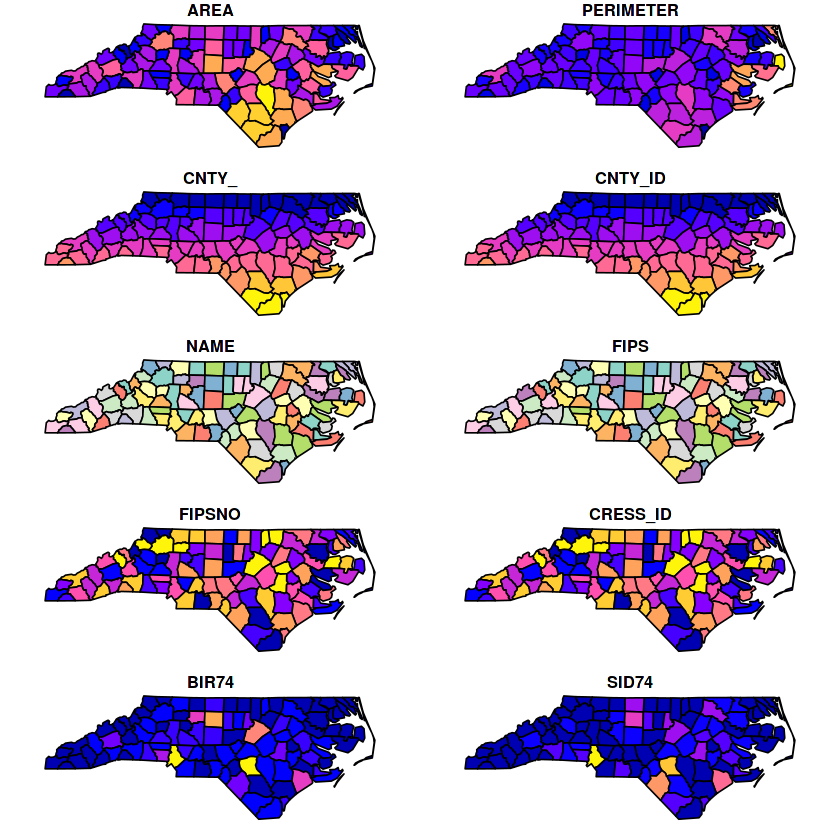
system.file("gpkg/nc.gpkg", package="sf") %>% read_sf -> nc
plot(nc)
In [15]:
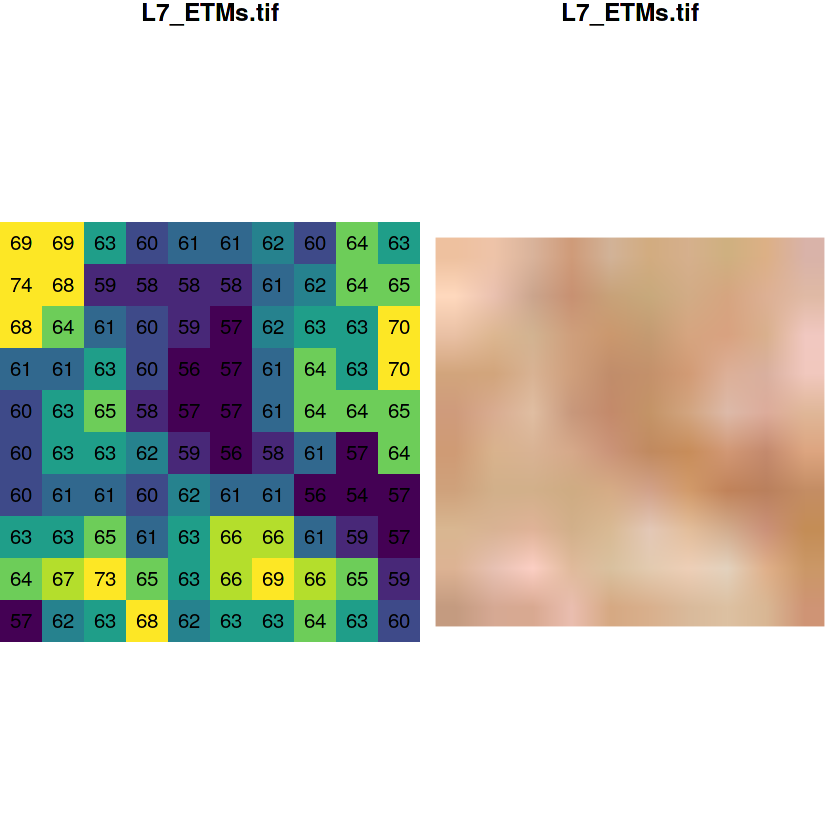
tif = system.file("tif/L7_ETMs.tif", package = "stars")
x = read_stars(tif)
par(mfrow = c(1, 2))
plot(x[,1:10,1:10,1], text_values=TRUE, key.pos = NULL, col = viridis::viridis(10),
    reset = FALSE)
plot(x[,1:10,1:10,1:3], rgb=1:3, interpolate = TRUE, reset = FALSE)
In [19]:
nc %>% st_transform(32119) %>%
    ggplot(., aes(fill = BIR74)) + geom_sf() + theme_void() +
    scale_fill_gradientn(colors = viridis::viridis(20))
In [21]:
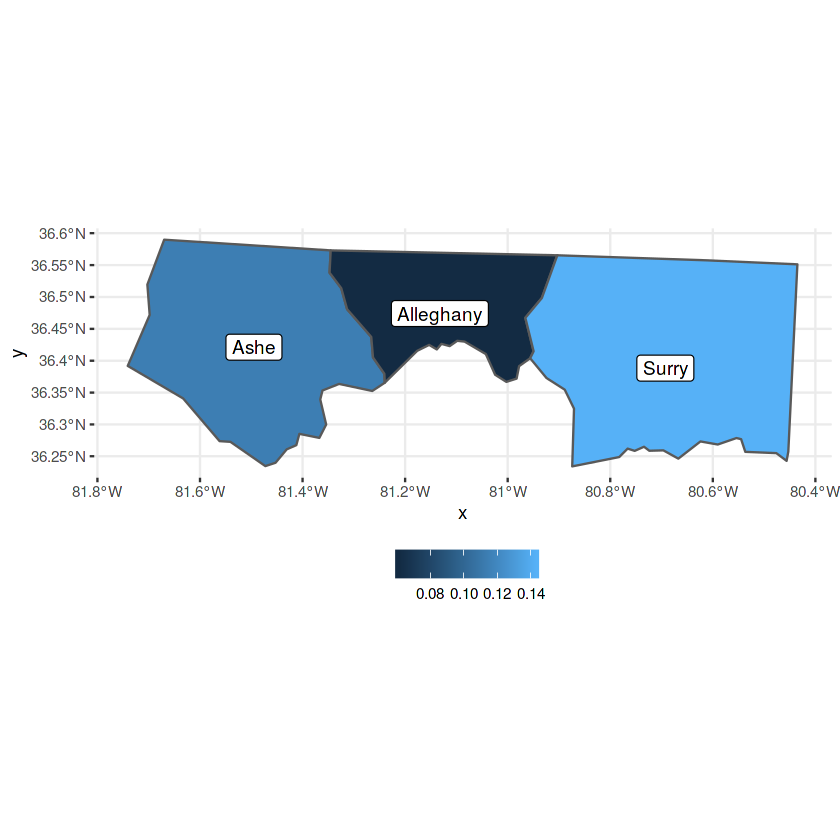
nc_3857 <- sf::st_transform(nc, "+init=epsg:3857")
ggplot() +
    geom_sf(data = nc_3857[1:3, ], aes(fill = AREA)) +
    geom_sf_label(data = nc_3857[1:3, ], aes(label = NAME))
In [24]:
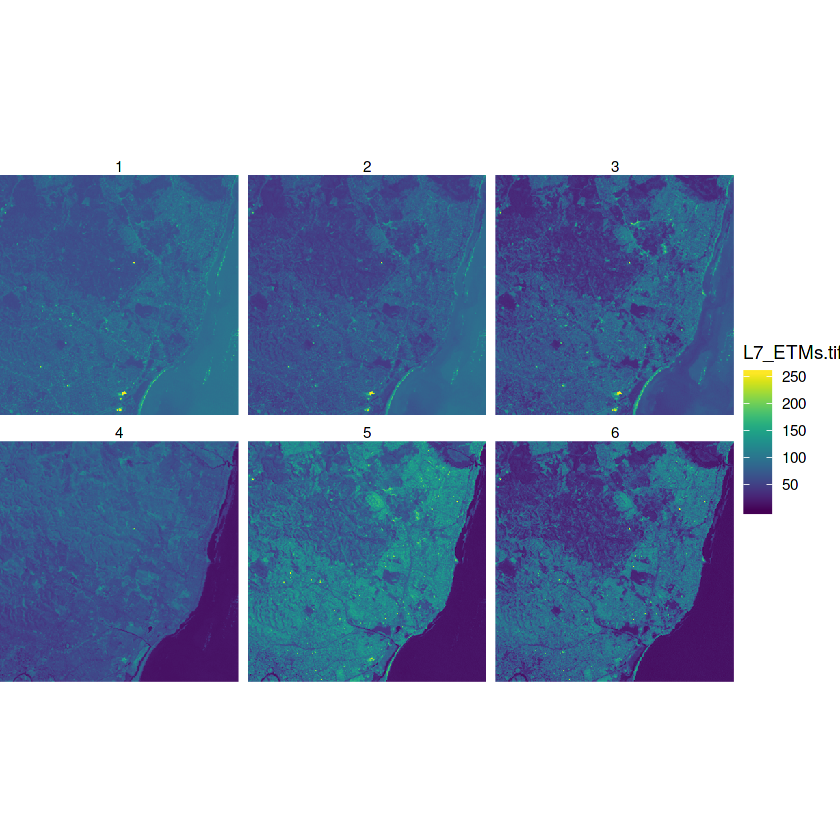
system.file("tif/L7_ETMs.tif", package = "stars") %>% read_stars() -> x
g = ggplot() +
    coord_equal() +
    scale_fill_viridis() +
    theme_void() +
    scale_x_discrete(expand=c(0,0)) +
    scale_y_discrete(expand=c(0,0))
g + geom_stars(data = x) +
    facet_wrap(~band)
Geostatistics
In [6]:
files = list.files("aq", pattern = "*.csv", full.names = TRUE)
files[1:5]
In [7]:
r = lapply(files[-1], function(f) read.csv(f))
In [8]:
Sys.setenv(TZ = "UTC") # make sure times are not interpreted as DST
r = lapply(r, function(f) {
        f$t = as.POSIXct(f$DatetimeBegin)
        f[order(f$t), ]
    }
)
In [9]:
r = r[sapply(r, nrow) > 1000]
names(r) =  sapply(r, function(f) unique(f$AirQualityStationEoICode))
length(r) == length(unique(names(r)))
In [10]:
r = lapply(r, function(f) xts(f$Concentration, f$t))
aq = do.call(cbind, r)
In [31]:
sel = apply(aq, 2, function(x) sum(is.na(x)) < 0.75 * 365 * 24)
aqsel = aq[, sel] # stations are in columns
aqsel %>% head()
In [32]:
read.csv("AirBase_v8_stations.csv", sep = "\t", stringsAsFactors = FALSE) %>%
    as_tibble  %>%
    filter(country_iso_code == "DE", station_type_of_area == "rural",
                 type_of_station == "Background") -> a2
a2.sf = st_as_sf(a2, coords = c("station_longitude_deg", "station_latitude_deg"),
                 crs = 4326)
In [33]:
# rural
sel =  colnames(aqsel) %in% a2$station_european_code
aqsel = aqsel[, sel]
In [35]:
tb = tibble(NO2 = apply(aqsel, 2, mean, na.rm = TRUE), station_european_code = colnames(aqsel))
crs = 32632
right_join(a2.sf, tb) %>% st_transform(crs) -> no2.sf
no2.sf %>% head()
In [34]:
#> Joining, by = "station_european_code"
# load German boundaries
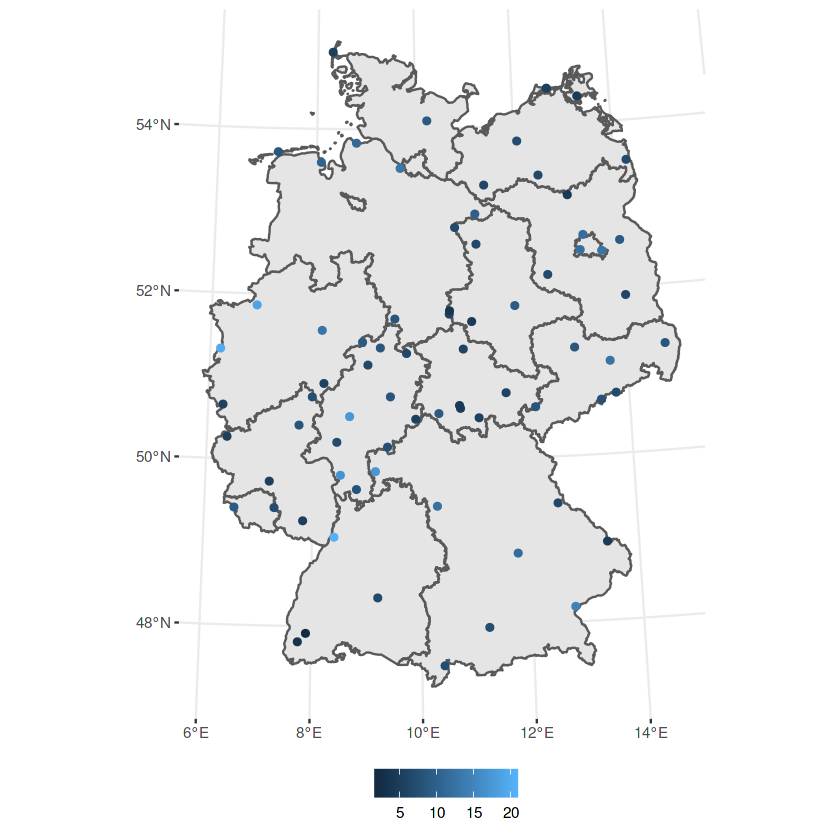
data(air, package = "spacetime")
de <- st_transform(st_as_sf(DE_NUTS1), crs)
ggplot() + geom_sf(data = de) +  geom_sf(data = no2.sf, mapping = aes(col = NO2))
Variogram
$$ \hat{\gamma}\left(h_{i}\right)=\frac{1}{2 N\left(h_{i}\right)} \sum_{j=1}^{N\left(h_{i}\right)}\left(z\left(s_{i}\right)-z\left(s_{i}+h^{\prime}\right)\right)^{2}, \quad h_{i, 0} \leq h^{\prime}<h_{i, 1} $$In [21]:
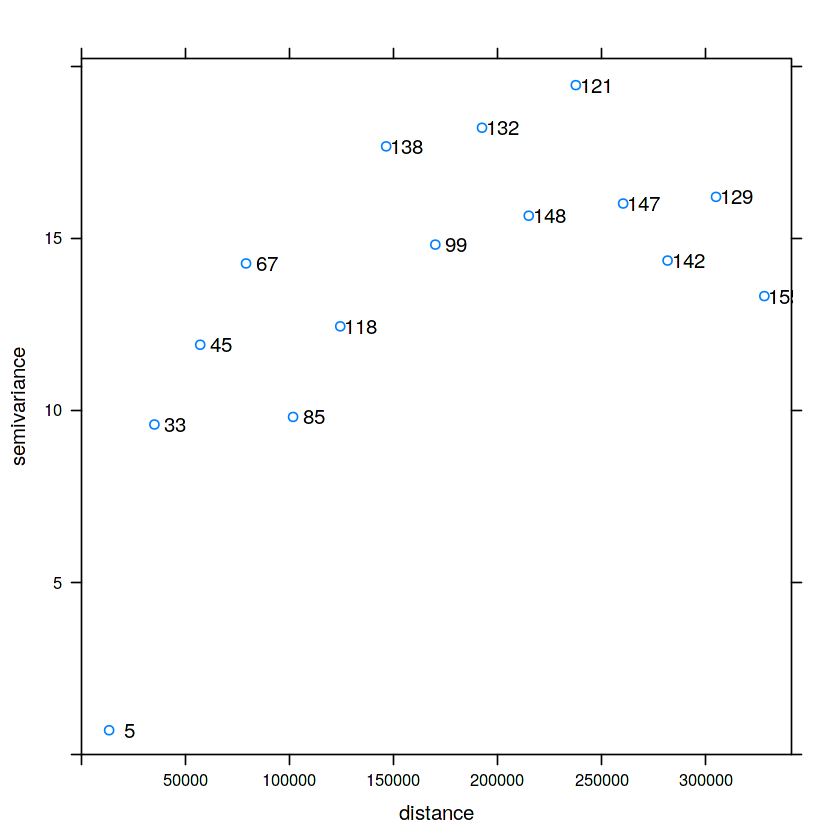
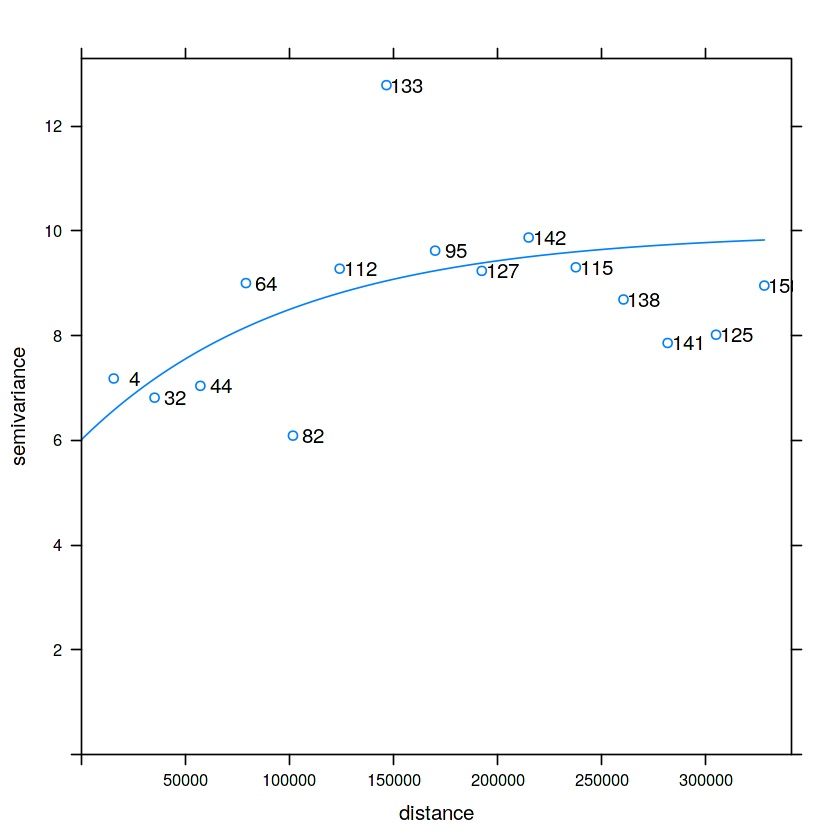
v = variogram(NO2~1, no2.sf)
plot(v, plot.numbers = TRUE)

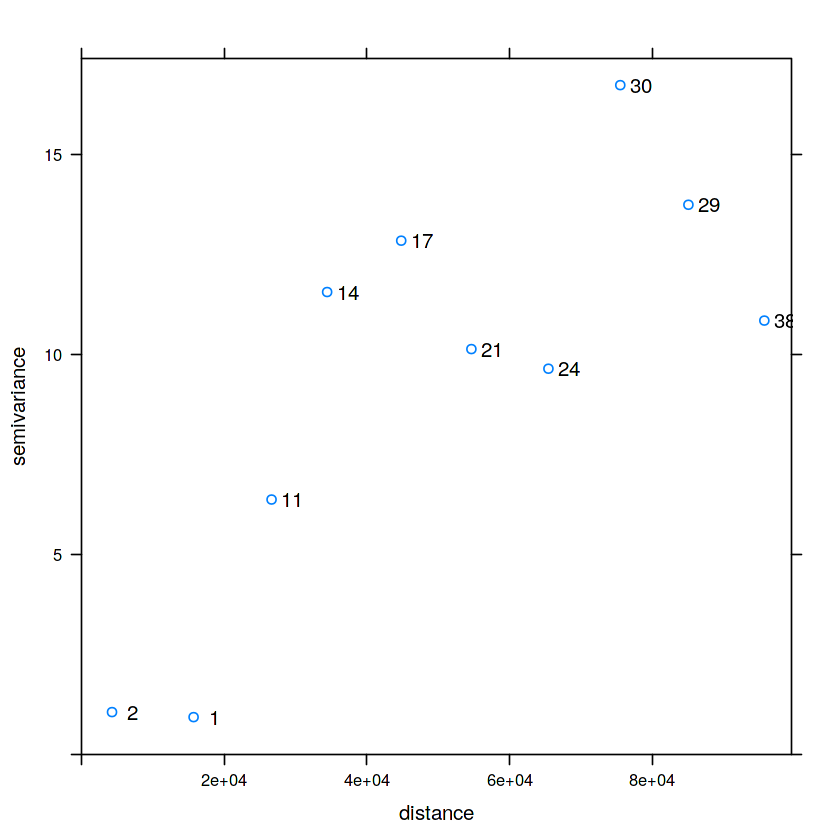
v0 = variogram(NO2~1, no2.sf, cutoff = 100000, width = 10000)
plot(v0, plot.numbers = TRUE)
Variogram models
In [22]:
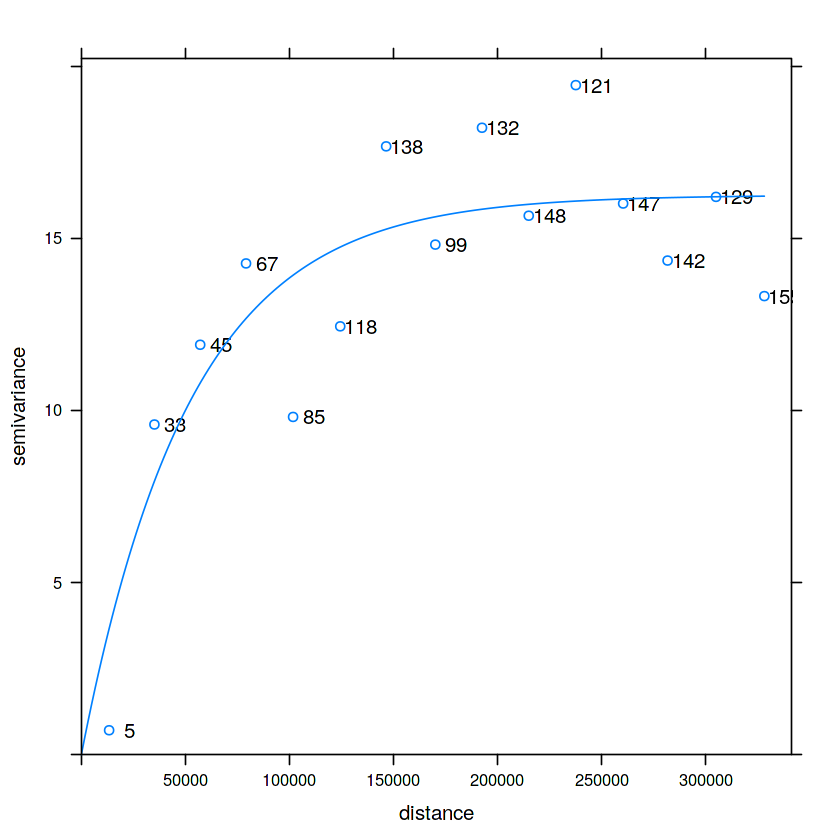
v.m = fit.variogram(v, vgm(1, "Exp", 50000, 1))
plot(v, v.m, plot.numbers = TRUE)
Kriging
In [23]:
st_bbox(de) %>%
  st_as_stars(dx = 10000) %>%
  st_set_crs(crs) %>%
  st_crop(de) -> grd
grd
In [24]:
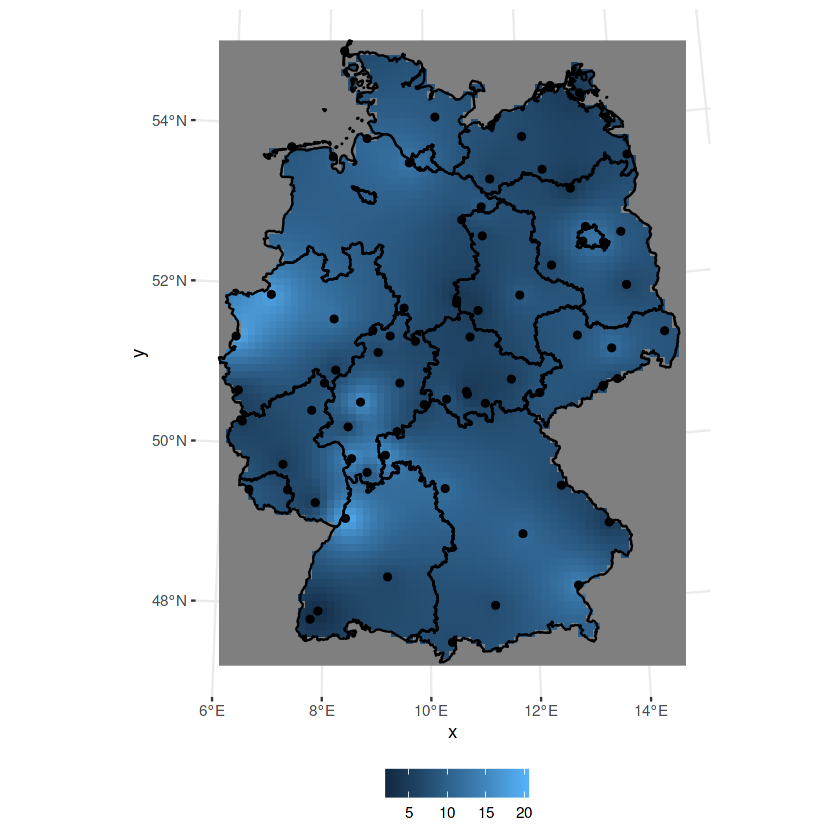
k = krige(NO2~1, no2.sf, grd, v.m)
#> [using ordinary kriging]
ggplot() + geom_stars(data = k, aes(fill = var1.pred, x = x, y = y)) +
    geom_sf(data = st_cast(de, "MULTILINESTRING")) +
    geom_sf(data = no2.sf)
Areal Means / Block Kriging
In [25]:
a = aggregate(no2.sf["NO2"], by = de, FUN = mean)
b = krige(NO2~1, no2.sf, de, v.m)
In [26]:
b$sample = a$NO2
b$kriging = b$var1.pred
b %>% select(sample, kriging) %>% gather(var, NO2, -geometry) -> b2
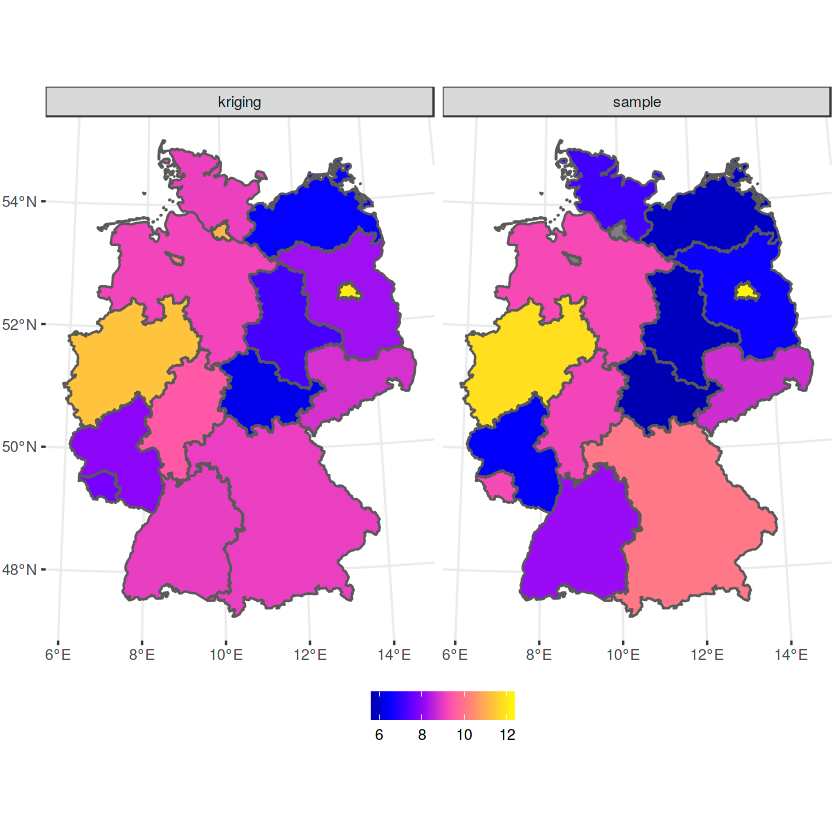
ggplot() + geom_sf(data = b2, mapping = aes(fill = NO2)) + facet_wrap(~var) +
     scale_fill_gradientn(colors = sf.colors(20))
In [27]:
SE = function(x) sqrt(var(x)/length(x))
a = aggregate(no2.sf["NO2"], de, SE)
In [28]:
b$sample = a$NO2
b$kriging = sqrt(b$var1.var)
b %>% select(sample, kriging) %>% gather(var, NO2, -geometry) -> b2
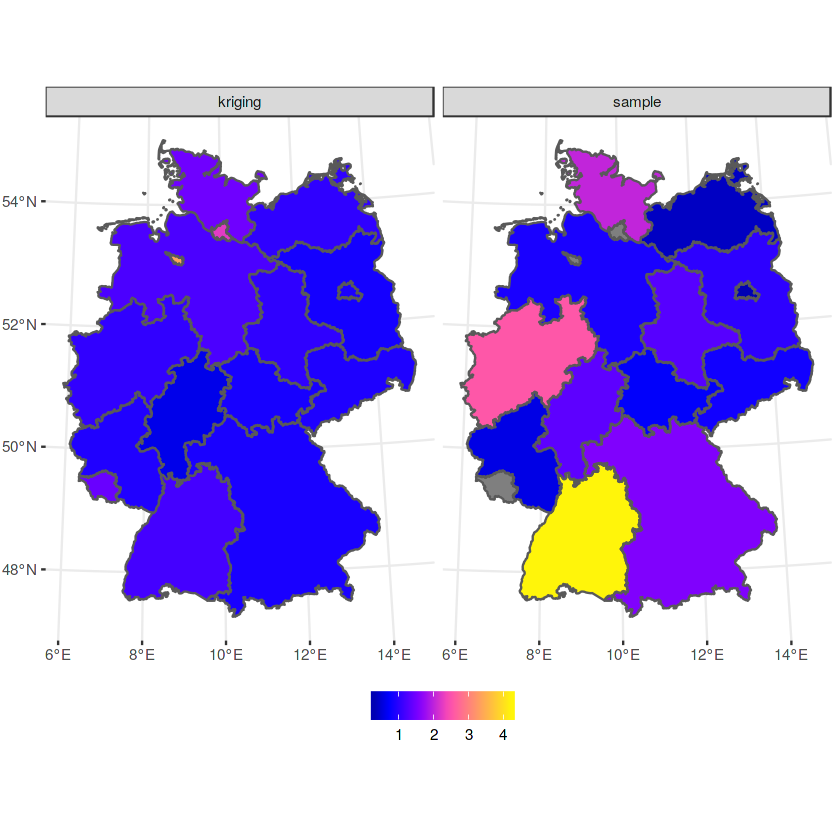
ggplot() + geom_sf(data = b2, mapping = aes(fill = NO2)) + facet_wrap(~var) +
     scale_fill_gradientn(colors = sf.colors(20))
Simulation
In [29]:
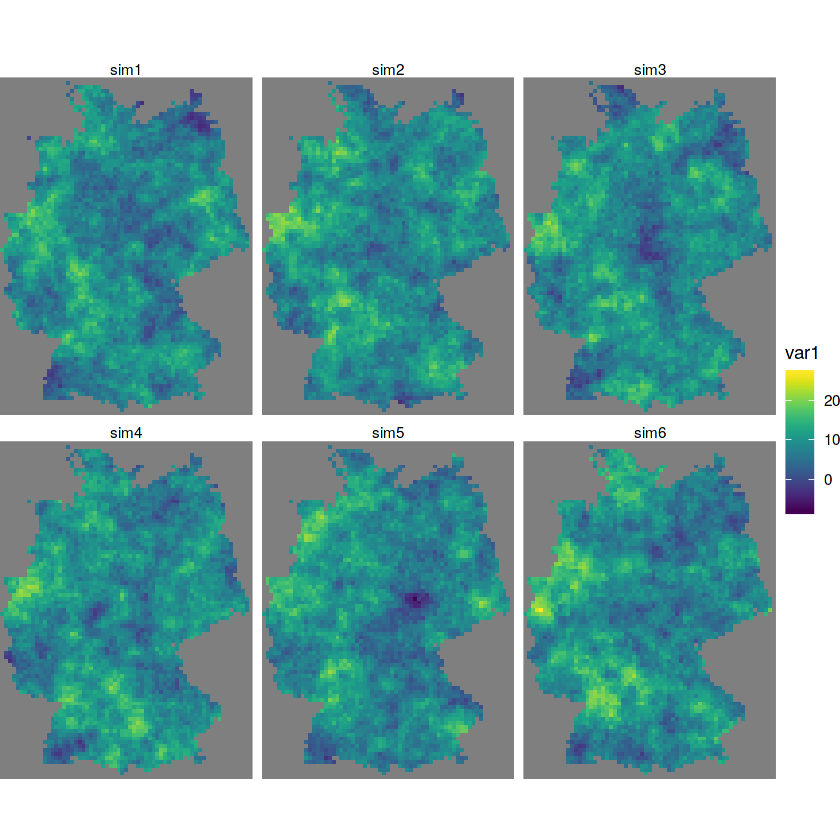
s = krige(NO2~1, no2.sf, grd, v.m, nmax = 30, nsim = 10)
#> drawing 10 GLS realisations of beta...
#> [using conditional Gaussian simulation]
g = ggplot() + coord_equal() +
    scale_fill_viridis() +
    theme_void() +
    scale_x_discrete(expand=c(0,0)) +
    scale_y_discrete(expand=c(0,0))
g + geom_stars(data = s[,,,1:6]) + facet_wrap(~sample)
Spatial Covariance Models with Covariates
$$ Z(s) = \sum_{j=0}^p \beta_j X_p(s) + e(s) $$In [36]:
v = fread("pop/Zensus_Bevoelkerung_100m-Gitter.csv")
v %>% head()
In [37]:
v %>% filter(Einwohner > 0) %>%
    select(-Gitter_ID_100m) %>%
    st_as_sf(coords = c("x_mp_100m", "y_mp_100m"), crs = 3035) %>%
    st_transform(st_crs(grd)) -> b
a = aggregate(b, st_as_sf(grd, na.rm = FALSE), sum)
In [38]:
grd$ID = 1:prod(dim(grd)) # so we can find out later which grid cell we have
ii = st_intersects(grd["ID"], st_cast(st_union(de), "MULTILINESTRING"))
In [39]:
grd_sf = st_as_sf(grd["ID"], na.rm = FALSE)[lengths(ii) > 0,]
iii = st_intersection(grd_sf, st_union(de))
In [40]:
grd$area = st_area(grd)[[1]] + units::set_units(grd$values, m^2) # NA's
grd$area[iii$ID] = st_area(iii)
In [41]:
grd$pop_dens = a$Einwohner / grd$area
sum(grd$pop_dens * grd$area, na.rm = TRUE) # verify
sum(b$Einwohner)
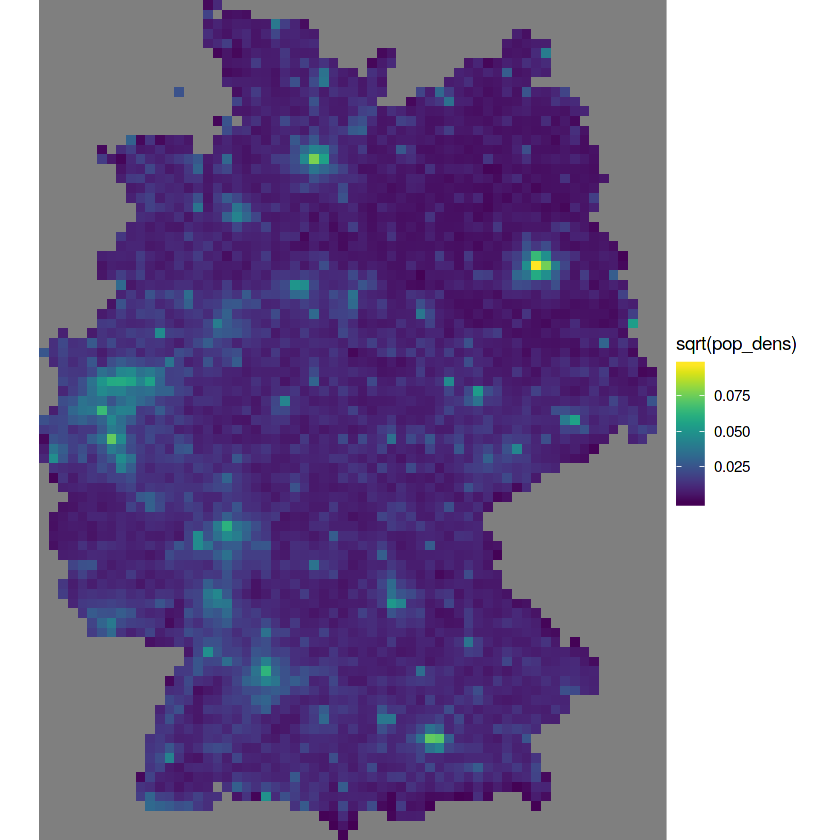
g + geom_stars(data = grd, aes(fill = sqrt(pop_dens), x = x, y = y))
In [42]:
(a = aggregate(grd["pop_dens"], no2.sf, mean))
In [43]:
no2.sf$pop_dens = st_as_sf(a)[[1]]
summary(lm(NO2~sqrt(pop_dens), no2.sf))
In [44]:
no2.sf = no2.sf[!is.na(no2.sf$pop_dens),]
vr = variogram(NO2~sqrt(pop_dens), no2.sf)
vr.m = fit.variogram(vr, vgm(1, "Exp", 50000, 1))
plot(vr, vr.m, plot.numbers = TRUE)
In [45]:
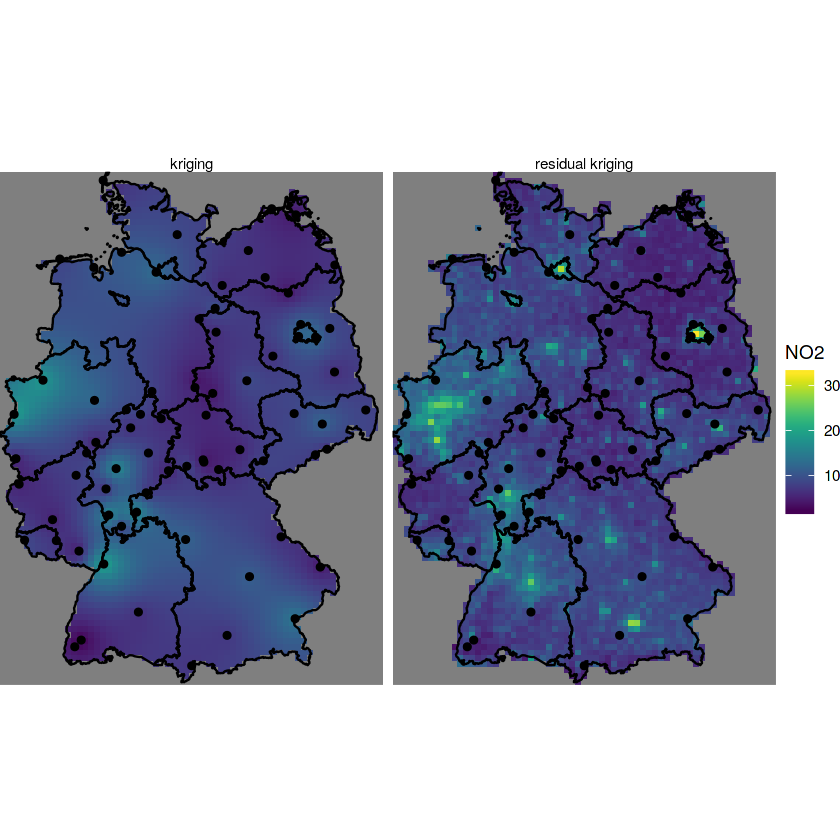
kr = krige(NO2~sqrt(pop_dens), no2.sf, grd["pop_dens"], vr.m)
k$kr1 = k$var1.pred
k$kr2 = kr$var1.pred
In [46]:
st_redimension(k[c("kr1", "kr2")],
    along = list(what = c("kriging", "residual kriging"))) %>%
    setNames("NO2") -> km
g + geom_stars(data = km, aes(fill = NO2, x = x, y = y)) +
    geom_sf(data = st_cast(de, "MULTILINESTRING")) +
    geom_sf(data = no2.sf) + facet_wrap(~what)
Spatiotemporal variogram
In [47]:
aqx = aq[,colnames(aq) %in% a2$station_european_code]
sfc = st_geometry(a2.sf)[match(colnames(aqx), a2.sf$station_european_code)]
st_as_stars(NO2 = as.matrix(aqx)) %>%
    st_set_dimensions(names = c("time", "station")) %>%
    st_set_dimensions("time", index(aqx)) %>%
    st_set_dimensions("station", sfc) -> no2.st
In [52]:
no2.st %>% glimpse
In [47]:
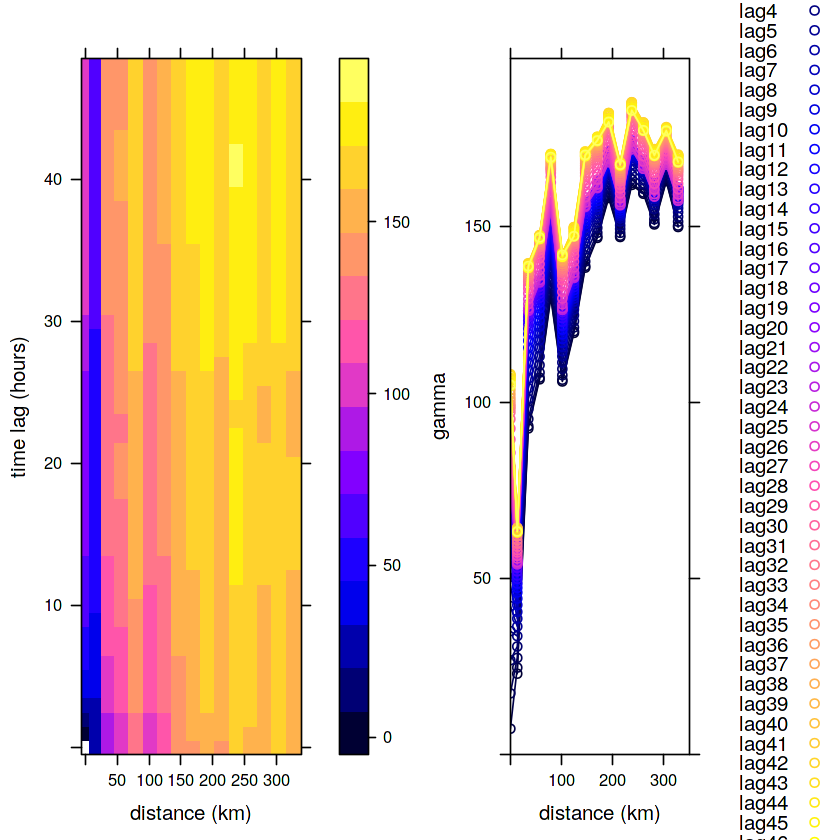
v.st = variogramST(NO2~1, no2.st[,1:(24*31)], tlags = 0:48)
In [48]:
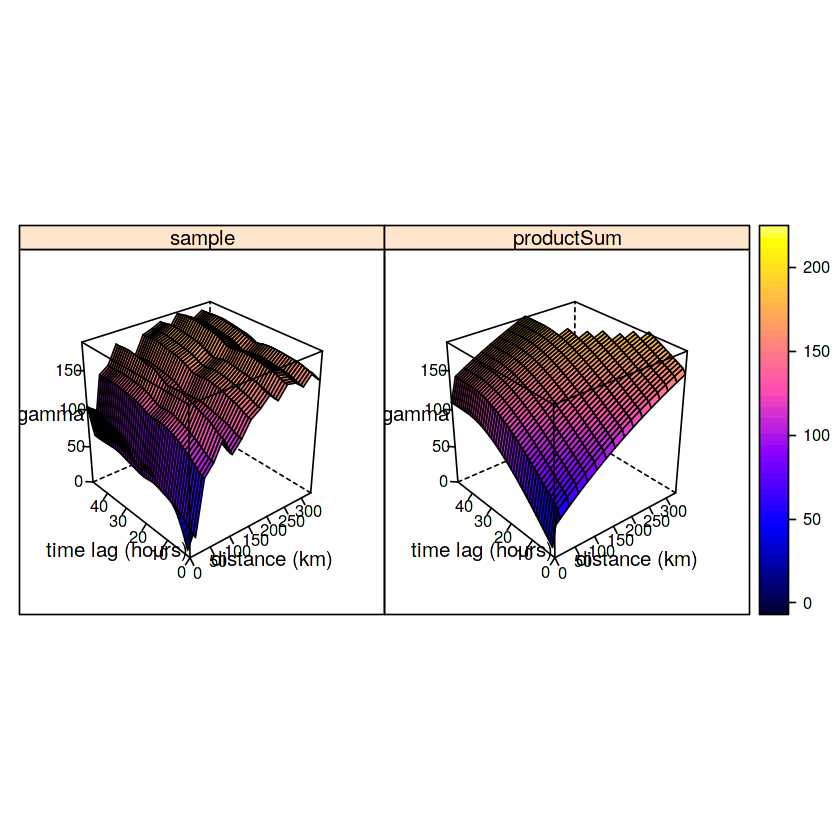
v1 = plot(v.st)
v2 = plot(v.st, map = FALSE)
print(v1, split = c(1,1,2,1), more = TRUE)
print(v2, split = c(2,1,2,1), more = FALSE)
In [49]:
prodSumModel <- vgmST("productSum",
    space=vgm(150, "Exp", 200, 0),
    time= vgm(20, "Sph",   40, 0),
    k=2)
StAni = estiStAni(v.st, c(0,200000))
(fitProdSumModel <- fit.StVariogram(v.st, prodSumModel, fit.method = 7,
    stAni = StAni, method = "L-BFGS-B",
    control = list(parscale = c(1,10,1,1,0.1,1,10)),
    lower = rep(0.0001, 7)))
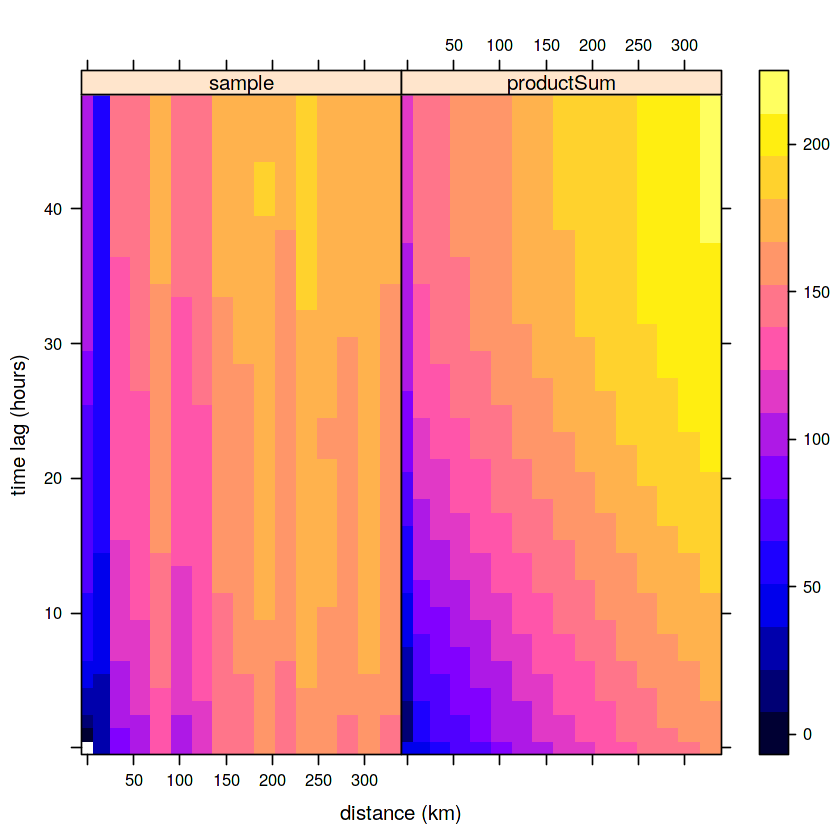
In [50]:
plot(v.st, fitProdSumModel, wireframe=FALSE, all=TRUE,
     scales=list(arrows=FALSE), zlim=c(0,150))
In [51]:
plot(v.st, model=fitProdSumModel, wireframe=TRUE, all=TRUE,
     scales=list(arrows=FALSE), zlim=c(0,185))
Spatial Autocorrelation
In [3]:
data(pol_pres15, package="spDataLarge")
head(pol_pres15[, c(1, 4, 6)])
In [4]:
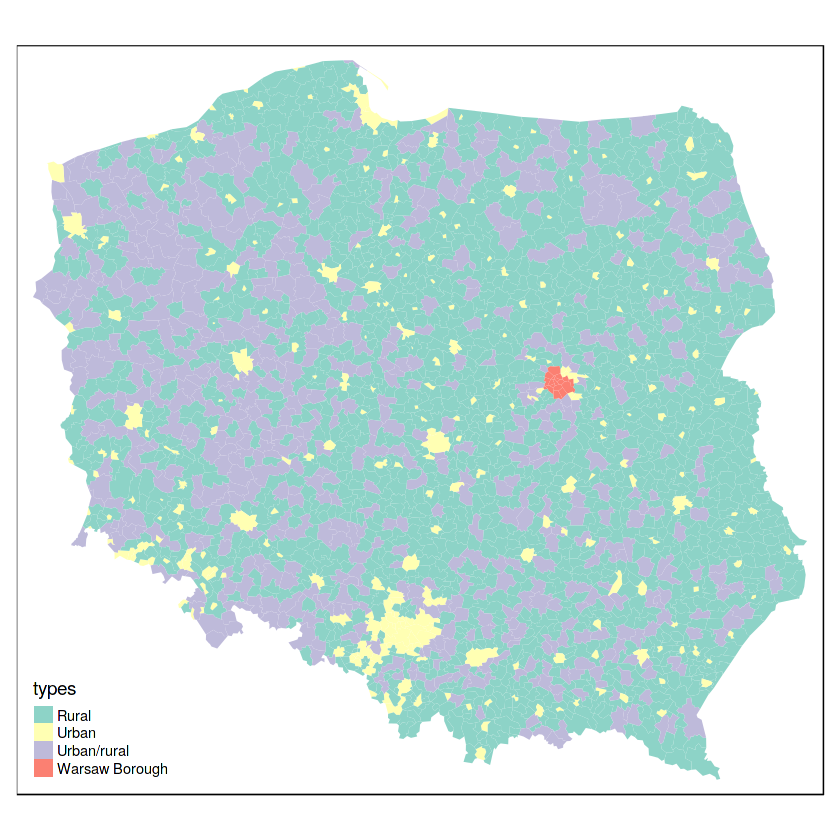
tm_shape(pol_pres15) + tm_fill("types")
Neighbourhood construction
In [5]:
args(poly2nb)
In [6]:
system.time(nb_q <- poly2nb(pol_pres15, queen=TRUE))
In [7]:
nb_q
In [8]:
system.time({
  fB <- rgeos::gUnarySTRtreeQuery(as(pol_pres15, "Spatial"))
  nb_q1 <- poly2nb(pol_pres15, queen=TRUE, foundInBox=fB)
})
In [9]:
st_queen <- function(a, b = a) st_relate(a, b, pattern = "F***T****")
as.nb.sgbp <- function(x, ...) {
  attrs <- attributes(x)
  x <- lapply(x, function(i) { if(length(i) == 0L) 0L else i } )
  attributes(x) <- attrs
  class(x) <- "nb"
  x
}
In [71]:
system.time(nb_sf_q <- as.nb.sgbp(st_queen(pol_pres15)))
Preferred method : rgeos::gUnarySTRtreeQuery without overhead
In [10]:
system.time({
  fB1 <- st_intersects(st_as_sfc(lapply(st_geometry(pol_pres15), function(x) {
    st_as_sfc(st_bbox(x))[[1]]
  })))
  fB1a <- lapply(seq_along(fB1), function(i) fB1[[i]][fB1[[i]] > i])
  fB1a <- fB1a[-length(fB1a)]
  nb_sf_q1 <- poly2nb(pol_pres15, queen=TRUE, foundInBox=fB1a)
})
In [11]:
all.equal(nb_q, nb_sf_q1, check.attributes=FALSE)
Pysal Compatibility
In [75]:
# tf <- tempfile(fileext=".gal")
# write.nb.gal(nb_q, tf)
In [ ]:
# use_python(python='/home/alal/anaconda3/envs/gds/bin/python')
# np <- import("numpy")
# libpysal <- import("libpysal")
# nb_gal_ps <- libpysal$io$open(tf)$read()
# nb_gal_ps$pct_nonzero
Graph based neighbours
In [14]:
coords <- st_centroid(st_geometry(pol_pres15), of_largest_polygon=TRUE)
suppressMessages(nb_tri <- tri2nb(coords))
nb_tri
nb_tri %>% glimpse
In [13]:
summary(unlist(nbdists(nb_tri, coords)))
table(pol_pres15$types, card(nb_q))
Sphere of Influence Neighbours
In [15]:
nb_soi <- graph2nb(soi.graph(nb_tri, coords))
nb_soi
In [16]:
n_comp <- n.comp.nb(nb_soi)
n_comp$nc
In [17]:
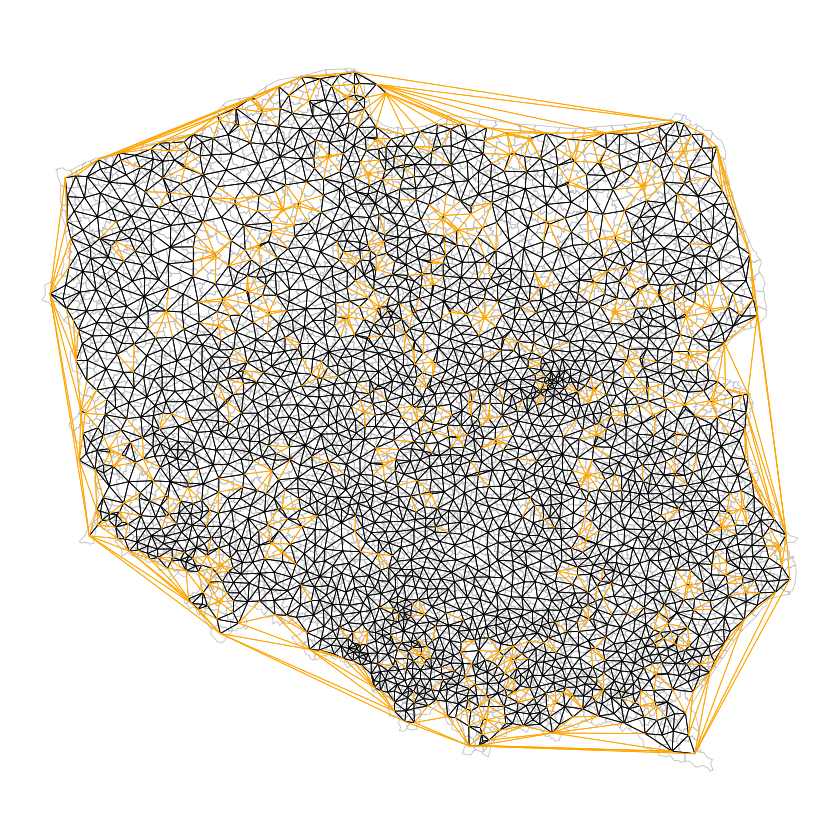
opar <- par(mar=c(0,0,0,0)+0.5)
plot(st_geometry(pol_pres15), border="grey", lwd=0.5)
plot(nb_soi, coords=st_coordinates(coords), add=TRUE, points=FALSE, lwd=0.5)
plot(diffnb(nb_tri, nb_soi), coords=st_coordinates(coords), col="orange",
     add=TRUE, points=FALSE, lwd=0.5)
par(opar)
Distance based Neighbours
In [18]:
k1 <- knn2nb(knearneigh(coords))
k1dists <- unlist(nbdists(k1, coords))
summary(k1dists)
In [20]:
nb_d18 <- dnearneigh(coords, 0, 18000)
nb_d18
nb_d183 <- dnearneigh(coords, 0, 18300)
nb_d183
In [21]:
arha <- units::set_units(st_area(pol_pres15), hectare)
aggregate(arha, list(pol_pres15$types), mean)
Weights specification
B weights
In [23]:
lw_q_B <- nb2listw(nb_q, style="B")
unlist(spweights.constants(lw_q_B))
Inverse distance weights
In [24]:
gwts <- lapply(nbdists(nb_d183, coords), function(x) 1/(x/1000))
lw_d183_idw_B <- nb2listw(nb_d183, glist=gwts, style="B")
unlist(spweights.constants(lw_d183_idw_B))[c(1,6:8)]
Measures of Spatial Autocorrelation
Moran's I
$$ I = \frac{ n \sum_{(2)} w_{ij} z_i z_j }{ S_0 \sum_{i=1}^N z_i^2} $$where $x_i, i = 1, \dots, n$ are $n$ observations of interest, $z_i = x_i - \bar{x}$ is a demeaned variable, $\sum_{(2)} = \sum_{i=1, i \neq j}^n \sum_{j=1}^n$, $w_{ij}$ are spatial weights, and $S_0 = \sum_{(2)} w_{ij}$.
Inference made on
$ Z(I) = \frac{I - E(I) } { \sqrt{Var(I)}} $
In [25]:
set.seed(1)
x <- rnorm(nrow(pol_pres15))
mt <- moran.test(x, lw_q_B, randomisation=FALSE)
In [26]:
glance_htest <- function(ht) c(ht$estimate, "Std deviate"=unname(ht$statistic), "p.value="=unname(ht$p.value))
broom_ok <- FALSE
if (names(broom::tidy(mt))[1] == "Moran I statistic") broom_ok <- TRUE
if (broom_ok) broom::tidy(mt)[,1:5] else glance_htest(mt)
In [27]:
beta <- 0.5e-02
t <- st_coordinates(coords)[,1]/1000
x_t <- x + beta*t
mt <- moran.test(x_t, lw_q_B, randomisation=FALSE)
if (broom_ok) broom::tidy(mt)[,1:5] else glance_htest(mt)
In [28]:
lmt <- lm.morantest(lm(x_t ~ t), lw_q_B)
if (broom_ok) broom::tidy(lmt)[,1:5] else glance_htest(lmt)
Global Measures
In [29]:
table(pol_pres15$types)
In [30]:
jcl <- joincount.test(pol_pres15$types, listw=lw_q_B)
if (broom_ok) {
    nm <- tibble::enframe(sapply(jcl, function(t) {
      nm <- substring(names(t$statistic), 18)
      paste0(nm, ":", nm)
    }))
    mat <- cbind(nm, do.call("rbind", (lapply(jcl, broom::tidy))))
    names(mat)[3] <- "Joincount"
    names(mat)[6] <- "Std.deviate"
    names(mat)[2] <- ""
    mat[,2:6]
} else {
    mat <- t(sapply(jcl, glance_htest))
    colnames(mat)[1] <- "Joincount"
    rownames(mat) <- sapply(jcl, function(t) {
      nm <- substring(names(t$statistic), 18)
      paste0(nm, ":", nm)
    })
    mat
}
In [31]:
joincount.multi(pol_pres15$types, listw=lw_q_B)
In [ ]:
