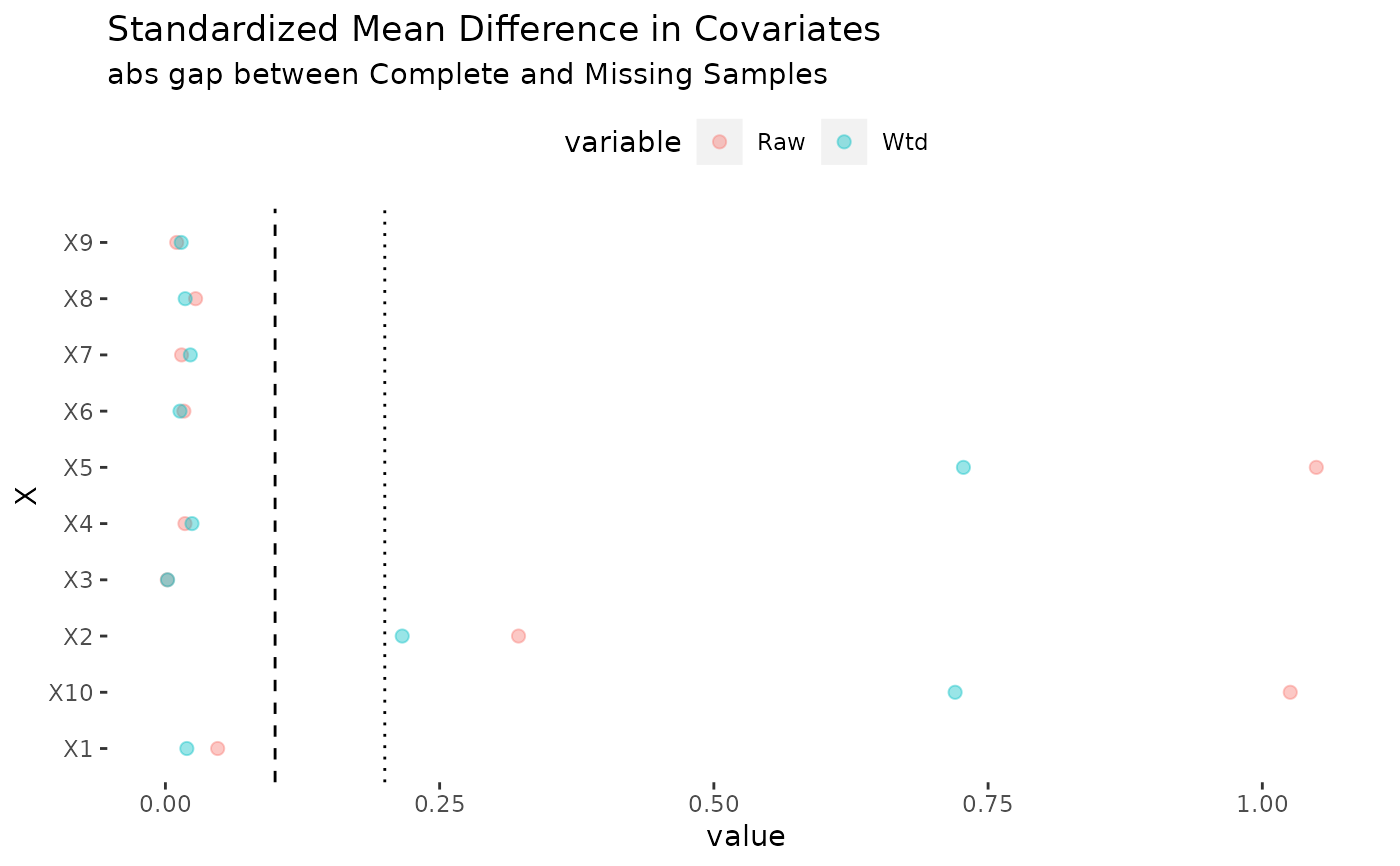
SMD balance plot method - plots balance across covariates and gains from reweighting
plot.ategt.RdSMD balance plot method - plots balance across covariates and gains from reweighting
Usage
# S3 method for ategt
plot(fit, X)Examples
sim = selDGP(selF = \(x) -3 * x[5] + x[2] + 3 * x[10])
fit = with(sim, ateGT(y = y, a = a, X = X, s = s))
fit %>% summary
#>      parameter       est         se     ci.ll    ci.ul pval
#> 1      E{Y(0)} 0.8420019 0.08622681 0.6729974 1.011006    0
#> 2      E{Y(1)} 2.1052116 0.08401517 1.9405419 2.269881    0
#> 3 E{Y(1)-Y(0)} 1.2632097 0.11263085 1.0424532 1.483966    0
mean(sim$tau)
#> [1] 1.1734
plot(fit, sim$X)