This note is a high-fidelity Markdown migration of the Causal Inference chapter from the LaTeX source.
Parent map: index Prerequisites: probability-and-mathstats, linear-regression
Concept map
flowchart TD A[Potential Outcomes] --> B[Randomized Experiments] A --> C[Selection on Observables] C --> D[Regression Adjustment] C --> E[Matching / IPW / AIPW] A --> F[Instrumental Variables] F --> G[LATE / Compliers] F --> H[MTE] A --> I[RD / RDD] A --> J[DiD / Panel] J --> K[Staggered Adoption] J --> L[Synthetic Control] A --> M[Decomposition Methods] A --> N[Causal DAGs]
Foundations, Experiments
Potential Outcomes
Exposition from
is the observed outcome, is the treatment with levels ,
potential outcomes denoted (interchangeably).
Equivalently, we have the switching equation
This encodes what is known as the causal-consistency assumption (/ SUTVA).
Generally, define a potential outcome
where is a vector of observed covariates and is a vector of unobservables, and is an unknown measurable function. Typically, we are interested in non-parametric identification of or some features of it.
Given a population of units, the assignment mechanism is a row-exchangeable function taking values on and satisfying
A unit level assignment probability for unit is
A finite population propensity score is
where is the number of units in each stratum defined by .
is a row-exchangeable function of potential outcomes, treatment assignment, and covariates.
are vectors of potential outcomes, is a covariate matrix, and is an assignment vector.
The most intuitive estimand is a vector . This is impossible to estimate because of the FPCI, so we instead use summaries, such as its sample average, or subgroup averages.
We never see both potential outcomes for any given unit.
Decompositions of Observed Differences:
where is the share of the sample treated.
This is a Missing Completely at Random (MCAR) assumption on potential outcomes.
Writing outcomes generated by the switching regression assumes that potential outcomes for any unit do not vary with the treatment assigned to other units. In practice, this is equivalent to a no spillovers assumption.
Equivalently, let denote a treatment vector for units, and be the potential outcome vector that would be observed if was based on allocation . Then, SUTVA requires that for allocations ,
Intuitively, SUTVA ensures that the ‘science table’ (Imbens & Rubin 2015) has 2 columns for the two potential outcomes as opposed to (number of potential outcomes with arbitrary interference).
Treatment Effects
Estimands
Under randomisation, , since the treated are a random sample of the population. Under weak(er) assumption of , only is identified.
Difference in Means
Variance of Difference in means estimator is given by
where are sample variances of respectively, and is the variance of the unit level treatment effect
This is not identifiable because of the last term. If the treatment effect is constant in the population, the last term is zero.
A (conservative) variance estimator is given by
where
These variance estimates can be used to construct 95% confidence intervals
Regression Adjustment
-
-
-
[extra terms above come from allowing for heterogeneous TEs]
Selection bias:
Suppose percent of the population gets the treatment. Let . Then,
Generalise to fraction treated
VCV under homoscedasticity
VCV under heteroskedasticity
Including controls:
Corrects for chance covariate imbalances, improves precision by removing variation in outcome accounted for by pre-treatment characteristics.
Freedman (2008) Critique
Regression of the form
is consistent for ATE but has small sample bias (unless model is true); bias is on the order of
precision does not improve through the inclusion of controls; including controls is harmful to precision if more than units are assigned to one treatment condition
Recommends fitting
Where the two potential outcomes are stipulated to follow
which has same small sample bias, but cannot hurt asymptotic precision even if the model is incorrect and will likely increase precision if covariates are predictive of the outcomes.
Randomisation Inference
sharp null: . Implies .
To test sharp null, set for all units and re-randomize treatment. Complete randomisation of units with treated. assignment vectors. value can be as small as .
is the full set of randomisation realisations, and is an element in the set (drawn either under complete randomization or binomial randomization), with associated probability
One sided P-value :
Blocking
Stratify randomisation to ensure that groups start out with identical observable characteristics on blocked factors.
if where and are errors from specification omitting and including block dummies respectively.
For blocks,
Point estimate
Variance Randomisations within each block are independent, so the variances are simple means (with squared weights).
Regression Formulation
If treatment probabilities vary by block, then weight by
Efficiency Gains from Blocking
Complete Randomisation : $Y_i = \alpha + \tau_{CR} D_i
- \epsilon_i$
Block Randomisation:
Where is the fit from regressing on all dummies. Since by randomisation,
Power Calculations
Basic idea: With large enough samples, [where is the share of sample treated]. Set to minimise overall variance. Yields . With homoskedasticity, this is Treatment, control.
(effect size)
Test for .
For common variance ,
General formula for Power with unequal variances
This yields
Common variance (assumed)
where = Critical t-value to reject null + t-value for alternative (where ) is power.
MDES (Minimum Detectable Effect Size in Standard Deviation Units):
Multiplier simplifies to
Rearrange to get necessary sample size for any given hypothesised MDE and expected variance.
MDES for Blocking
where is the R-squared from regressing on block dummies.
To test against the alternative, we look at the T Statistic
Inverting this for size gives us a required sample size
typically, , , so by substitution:
Selection On Observables
typology
Regression estimators: rely on consistent estimation of Matching estimators Propensity score estimators: rely on estimation of Combination methods (augmented IPW, bias-corrected Matching, etc)
Regression Anatomy / FWL
where is the residual from a regression of on all other covariates.
If structural (long) equation is , with vector of unobserved, and we estimate short , then we can write the specification as
equivalently,
Coefficient in Short Regression = Coefficient in long regression + effect of omitted regression of omitted on included. This bias can be arbitrarily large.
Identification of Treatment Effects under Unconfoundedness
- Unconfoundedness / Selection on Observables / Ignorability / Conditional Independence Assumption: In terms of densities, this is equivalent to the validity of the following density factorisation
- common support
The third quantity is estimable using observed data.
Estimators:
Discrete Case: has finite values indexed by with generic entry
Multi-valued and Continuous Treatments
Treatment values: finite if multi-valued / for continuous, with corresponding dose-responses . We are interested in dose-response function , and contrasts.
First define Generalised propensity score :
Assumptions: Weak unconfoundedness: Conditional density overlap:
Bias removal using the generalised propensity score: Estimate the conditional expectation of the outcome as a function of treatment level and GPS as Estimate the dose-response function of the treatment by averaging the conditional expectation at that particular level of treatment
Then compute contrasts to get first derivative (MTE)
Estimators of
which can be used to construct estimators of ATE(), ATT(, and other estimands. reference: , David Childers’ lecture notes.
Regression Adjustment
Estimate by a nonparametric regression estimator .
Since the average predicted treated outcome for the treated equals the average predicted control outcome for controls, one ATE form is
SATT only requires imputation of one potential outcome:
Inverse Propensity Weighting
Estimate propensity score by . Then
Augmented Inverse Propensity Weighting / Combination Methods
Estimate and , then average
Normalized outcome regression:
Subclassification / Blocking
Weighted combination of subclasses of covariate values, which partition the population
Regression Adjustment
A single regression with controls is potentially problematic because of Simpson’s paradox. To account for this in a parametric setup, assume a set of iid subjects we observe a tuple , comprised of
feature vector
response
treatment assignment
Define conditional response surfaces as
First pass regression adjustment estimator (using OLS)
where is obtained via OLS. This generically doesn’t work for regularised regression.
With known propensity score (as in case of regression), an efficient estimator weights all estimated treatment effects by the propensity score:
Additional Assumptions for consistent estimate of ATE from OLS:
-
Constant treatment effects
-
Outcomes linear in X
will provide unbiased and consistent estimates of ATE.
-
- fails - is Best Linear Approximation of average causal response function .
-
- fails - is conditional variance weighted average of underlying s.
Pretend there are strata of . Then, OLS estimates
where the weight
weighs up groups where the size of the treated and untreated population are roughly equal, and weighs down groups with large imbalances in the size of these two groups.
is true effect IFF constant treatment effects holds.
Matching
Regression estimators impute missing potential outcomes by imputing it using . Matching estimators proceed by imputing the potential outcome using the observed outcome from the ‘closest’ control unit.
Define as the index that satisfies
So, is the index of the unit in the opposite treatment group that is th closest to unit in terms of covariate values in terms of the norm . Let denote the indices of the first matches for unit . Then, impute potential outcomes as
then, the simple matching (with replacement) estimator for ATE is
and corresponding ATT
where corresponds with one-to-one matching and is many-to-one. Many-to-one matching is not consistent (Abadie and Imbens (2006)) and has a bias of where is the number of continuous covariates.
Bias-corrected (Abadie-Imbens)
Where is the regression function under the control.
Metrics
- Euclidian Distance
- Stata diagonal distance
where the normalisation factor is the diagonal element of $\hat{\Sigma}$, the estimated variance covariance matrix.
- Mahalanobis distance (scale-invariant)
Where is the variance-covariance matrix.
Matching estimators have a normal distribution in large samples provided that bias is small.
For matching without replacement,
For matching with replacement,
where is the number of times observation is used in a match, and the last error variance term is estimated by matching also. the bootstrap doesn’t work for matching.
PScore is a balancing score: conditioning on propensity score is equivalent to conditioning on covariates.
defines the semiparametric Efficiency Bound for ATE: the asymptotic variance of any regular estimator of of the population ATE obeys
where
and for PATE ()
where , , and .
Any regular estimator whose asymptotic variance achieves this efficiency bound is equal to , where
is the Efficient Influence Function for estimating .
shows that
Estimators in this section try to attain the SPEB.
and
The counterfactual mean can be identified as
where .
normalise both pieces using a Hajek-style adjustment, since extreme values of makes variance explode. Often advisable to trim or use Hajek weights, which introduces limited bias at the cost of large decreases in variance.
Similarly, for the effect on the treated
Horvitz-Thompson Estimator as Regression
with IPW weights
define the Weighted ATE (WATE) as
where is a weighting function. ATT is constructed when
the corresponding estimator is
Sample drawn from , and can represent a target population as where is the tilting function.
Define , which gives
For a given tilting function, to estimate , weight
Target Estimand
Combined 1 ATE [IPW] Treated ATT Control ATC Overlap ATO
Overlap weights are defined by choosing that minimises asymptotic variance of . The achieve exact balance on covariates included in the propensity score estimation.
can be interpreted as treatment effect among population that have good balance on observables.
Implemented in PSweight.
Entropy weights for each control unit are chosen by a reweighting scheme
subject to balance/moment-condition and normalising constraints
The above problem is convex but has dimensionality of (nonnegativity) + (moment conditions) + (normalisation). The dual, on the other hand, only has dimensionality and unconstrained, which is considerably easier to solve using Newton-Raphson.
propose CBPS, which is a method that involves modifying an initial propensity score estimate (e.g. by changing coefficients from a logistic model) iteratively until a balance criterion is reached.
Their basic insight is that when we use a logistic regression to estimate a propensity score, we assert that the pscore takes the form , and maximise the bernoulli log likelihood
which is then solved by the corresponding score
this score balances a particular function of covariates: . Alternatively, we could choose that function by specifying a moment condition
Analogously for ATT, this moment condition is
When this balance condition is solved independently, the problem is just-identified. When it is used in conjunction with the conventional bernoulli likelihood, the problem is over-identified. Implemented in CBPS::CBPS as well as balance.
The estimand is (with defined analogously). The estimator for this quantity is written
where the weights are chosen to satisfy the sample balance property
for any bounded function .
in words: for every function , the weighting function equates weighted averages of over the treated units to unweighted averages over the study population.
The weights are solved by solving an optimisation problem to trade off imbalance and some measure of complexity
with convex functions.
A common imbalance measure is
for
Hybrid Estimators
A doubly-robust estimator is consistent if one gets either the propensity score or the regression right.
Oracle AIPW
Feasible AIPW
This is the Augmented-Inverse-Propensity Weighting Estimator (AIPW) introduced by . Additional overviews:. General double-robustness property also shared by targeted maximum-likelihood estimators(TMLE) - due to .
Similarly, analogous estimator for ATT
where and is its empirical analogue.
The Cross-fit version can be stated as
where is a mapping that takes an observation and puts it into one of the folds. is an estimator excluding the fold.
Define individual treatment effect score as
Then,
We can form level- CIs :
grf has a forest-based implementation of AIPW
cf = causal_forest(X, Y, D)
ate_hat = average_treatment_effect(cf)
partially-linear setup
where is a scalar treatment indicator. Observations are independent but not necessarily identically distributed. We are interested in inference about that is robust to mistakes in model-selection.
Approximate and with linear combinations of control terms , which may contain interactions and non-linear transformations.
Assume approximate sparsity ( there are only a small number of relevant controls, and irrelevant controls have a high probability of being small).
Naive (incorrect) approach: use LASSO on an eqn of the form
where the treatment is not penalised. This will mean we drop any control that is highly correlated with the treatment if the control is moderately correlated with the outcome. Then, if we use a post-LASSO selection to estimate the treatment effect, the effect will be contaminated with an omitted variable bias.
recommended two-step approach
Estimate with LASSO, select predictive variables (i.e. those with nonzero coefficients) in
Estimate with LASSO, select predictive variables (i.e. those with nonzero coefficients) in
Estimate where [i.e. control for variables that are selected in either the first or second regression]
Let be the indices of the selected controls for the outcome and treatment respectively.
The post-double-selection estimator is
Can use plugin estimator for variance based on residuals
where
Implemented in hdm::rlassoEffect(., ’double selection’)
Let the target parameter solve the equation for known score function , vector of observables , and nuisance parameter . In fully parametric models, is simply the score function [derivative of the log-likelihood]. For ATE, .
In naive double-ML settings, . So, we replace with the Neyman-orthogonal score s.t.
which yields the Orthogonalised Moment Condition for some real-valued condition .
Using a Neyman-orthogonal score eliminates first-order biases arising from the replacement of with .
Reference:
Consider data with
Partial linear setup .
Score function is
$$\psi(\Sett{W}; \theta, \eta) = (Y - \Ubr{l(X)}{} - \theta(D
- \Ubr{m(X)}{})) (D - m(X))$$
Partially Linear IV
Score is
Interactive Regression
Here, the estimands are
The score function for ATE (Hahn (1998))
The nuisance parameter true value is . For ATET,
Take a -fold random partition of observation indices s.t. each fold has size . For each , define as the complement / auxiliary sample.
For each , construct a ML estimator of using only the auxiliary sample ;
For each , using the main sample , construct the estimator as the solution of
Aggregate the estimators on each main sample
Simple implementation of Cross-fitting for Treatment effects
Partition the data in two, such that each fold has size .
Using only sample , construct a ML estimator of and ,e.g. a feedforward nnet of on , denoted as , and logit-lasso of on , denoted by .
Use the estimators on the hold-out sample to compute the T.E
Repeat (2,3) swapping the roles of and to get
Aggregate the estimators:
Implemented in DoubleML
Augmented Balancing
Loosely: AIPW without the (potentially fraught) inversion of the propensity score step. Exposition based on Bruns-Smith et al (2023)
setup: Covariates , outcome, two populations and that are distributions over is ‘source’, is ‘target’ (e.g. treatment group and overall sample) Estimand is Identification Assumptions Conditional Mean Ignorability: Population Overlap: is absolutely continuous w.r.t.
Effect Functionals
Regression Functional
Weighting Functional
Doubly-Robust Functional
Balancing Weights: Rationale
is difficult to estimate using plug-in estimation Alternative: weighting for balance automatic estimation of the Riesz representer
Weighting to minimise covariate imbalance
Direct estimation of the density ratio
Minimum variance weights that balance are also guaranteed to balance all other measurable functions in .
In linear setting, relevant imbalance is captured entirely by feature mean imbalance are iid draws from , are m draws from Define feature map ; construct gram matrices Let Let denote dual norm [, ]
Three Equivalent Representations
Penalised form
Constrained form
Automatic form
OLS is equivalent to a weighting estimator that exactly balances the feature means. Let be the linear regression fit on (source sample). Then,
Analogue for Ridge
, and any linear balancing weight estimator with estimated coefficients , , and
In words: when both outcome and weighting models are linear, the augmented estimator is equivalent to a linear model with coefficients that are element-wise affine combinations of base learner and coefs from regressing on
Heterogeneous Treatment Effects with selection on observables
Conditional Average Treatment Effects (CATEs) () are often of great policy interest for targeting those who have largest potential gains. However, conventional methods are prone to a severe risk of fishing from researchers (cf ‘conditional effects’ in most published work in the social sciences).
Instead, recent work proposes to use nonparametric estimators to find subgroups, use sample-splitting for honesty.
transformed outcome regression use outcome transformed w pscore
conditional mean regression use the fact that under SOO
(1) typically inefficient because of pscore in denominator, so most focus is on (2). Random forests are a flexible method that is widely liked.
Consider a model for where
where for some pre-determined set of basis functions . We allow for non-parametric relationships between , but the treatment effect function itself is parametrised by . showed that under unconfoundedness, we can rewrite the semiparametric setup above as
where
The oracle algorithm for estimating is (1) define and , then estimate residuals-on-residual regression. This procedure is -consistent and asymptotically normal.
Use cross-fitting to emulate the Oracle.
Run non-parametric regressions and to get
define transformed features ,
Estimate by regressing
To define R-Loss , under more general setup restate unconfoundedness as follows
where
and follow Robinson’s approach to write
R-loss is then written
Define and The R-learner consists of the following steps
Use any method to estimate the response functions
Minimise R-loss using cross-fitting for nuisance components
where is a regulariser.
Causal forest as implemented by grf starts by fitting two separate trees to estimate , makes out-of-bag predictions [using cross-fitting] using the two first-stage forests, then grow causal forest via
where
are the learned adaptive weights.
Draw a subsample of size from the sample with replacement and divide it into disjoint sets .
Grow a tree via recursive partitioning, with splits chosen from (i.e. without using observations from sample)
Estimate leaf responses using only sample
Finally, aggregate all trees over subsamples of size
where summarises randomness in the selection of the variable when growing the tree, is shorthand for a training sample.
where the base learner
the ‘honesty’ property is making independent of , i.e. do not use the same data to select partition (splits) and make predictions.
Implemented in causalForest and grf.
Multi-action policy learning
units, to be assigned to actions , which has have corresponding rewards . Each observation has covariate . Define a policy function
A given policy assigns each unit to a treatment level. Each policy has a corresponding value function
An optimal policy is defined as
Deviations from this optimum is called regret
Define a CEF as
The first-best optimal rule is
In the binary action case, this simplifies to which is the conditional empirical success (CES) rule of Manski (2004).
Under unconfoundedness and Overlap, we can estimate s and construct an empirical analogue of the value function for a policy using the following familiar estimators
A -convergent estimator of the value function is the Cross-fit Augmented Inverse Probability Weighted Learning (CAIPWL) estimator of , which is constructed as a cross-fit analogue of the AIPW estimator.
Sensitivity Analysis
Check balance by computing SDiff for observable confounders
Three valued treatment indicator: corresponding with ineligibles, eligible nonparticipants, and participants. We can test unconfoundedness by comparing ineligibles with eligible nonparticipants, i.e. test
Placebo Outcomes
Covariates included lagged outcomes . Test e.g. Earnings in 1975 in Lalonde
is a nuisance parameter.
Where , and . .
Propensity score is Logistic:
indicates strength of relationship between and .
Y is conditionally normal
indicates strength of relationship between and .
MLE setup
Construct grid of and calculate the MLE for by maximising over .
Use 2 partial s:
-
: Residual variation in outcome explained by (after partialling out ).
-
: Residual variation in treatment assignment explained by (after partialling out ).
Draw threshold contours, should expect most covariates to be clustered around origin.
Rosenbaum (2002)[]
Tuning parameter that measures departure from zero hidden bias.
For any two observations and with identical covariate values , under unconfoundedness, probability of assignment into treatment should be identical
Treatment assignment probability may differ due to unobserved binary confounder . We can bound this by the ratio:
No bias. is twice as likely to be treated than despite identical .
is assumed to satisfy
For any given candidate , estimates of the treatment effect can be computed. Implemented in rbounds::hlsens.
Altonji, Elder, Taber (2005)
Only informative if selection on observables is informative about selection on unobservables.
How much does treatment effect move when controls are added? Estimate model with and without controls:
AET ratio:
Want to be as big as possible (i.e. under unconfoundedness).
Define proportional selection coefficient
Then,
where
are from a univariate regression of on
are from a regression including controls
is maximum achievable
True model is , but we don’t observe . We would like to quantify how biased the coefficient from the short regression is for the long regression coefficient . From OVB FOrmula, we know where is the conditional association between the omitted and (‘impact’) and is the coefficient from regressing on (‘imbalance’).
The bias from this omission is
They then define
where where is the partial Cohen’s of the treatment with the outcome, and is the proportion of reduction on the treatment coefficient that would be deemed problematic.
Partial Identification
the ATE can be decomposed as
The terms in red are counterfactual outcomes for which the data contains no information. Bounding approaches involve estimators for these missing quantities.
Suppose all we know is
w.l.o.g. given bounded support , we can always min-max rescale to
Width of possible interval learnable from data is at largest, at smallest, so worst case interval always contains 0. Need theory/assumptions to even get the sign right.
Assume bounded support for the outcome. Replace missing values with maximum () or minimum () of support. These are worst-case bounds and yield intervals that are basically uninformative.
And denote
Monotone Treatment Response: assume mean potential outcome under treatment cannot be lower than under control . Then
Monotone Treatment Selection: subjects select themselves into treatment in a way the mean potential outcomes of the treatment and control groups can be ordered. Positive MTS implies and . This implies and
Let denote the treatment effect and denote its distribution, and let denote the distributions of outcomes for the two potential outcomes. Then, where
Instrumental Variables
SOO Fails/ because of OVB, then is no longer consistent. Use as instrument for which isolates variation unrelated to the omitted variable.
Traditional IV Framework (Constant Treatment Effects)
Setup
Second Stage:
First Stage:
Reduced Form: $$\begin{aligned} Y & = \gamma_0 + \gamma_1 Z + u_3 \ & = \alpha_0 + \alpha_1 ( \pi_0 + \pi_1 Z + u_1) + u_2 \ & = (\alpha_0 + \alpha_1 \pi_0) + \underbrace{\hlred{(\alpha_1 \pi_1)}}_{\gamma_1} Z + (\alpha_1 u_1 + u_2)
\end{aligned}$$
Exogeneity (as good as random conditional on covariates):
Exclusion Restriction: , has no effect on except through .
Relevance: affects
With the above assumptions, we can write
This is equivalent to
With binary treatment and binary instrument, one can write the IV effect as
With multiple instruments or endogenous variables,
where is projected in the column space of
which nests 2SLS, LIML, and Fuller’s estimator as special cases. Specifically,
is OLS
is 2SLS
is LIML
is Fuller’s estimator
here, is the minimum value of that satisfies
Implemented in ivmodel, which takes model fits from AER::ivreg and computes LIML / k-class estimates.
Asymptotically, all class estimators are consistent for when .
Inference
Under homoscedasticity,
Under heteroskedasticity,
Test statistic and null distribution
Equivalently, Assuming the instrument is valid, we can test for whether is endogenous by estimating the following regression
where are the (fitted) residuals from estimating the first stage regression . A standard t-test for tests whether is exogenous assuming is a valid set of instruments. [means this test is not that useful in practice]
Weak Instruments
Second term non-zero if instrument is not exogenous. Let and [variance of first stage error] and be F statistic of the first-stage. Then, bias in IV is
If first stage is weak, bias approaches . As , .
When instruments are weak, AR confidence intervals are preferable to eyeballing F-statistics. Let be a matrix of , and let , (where is typically 0), and
be an estimator for the covariance matrix for the errors.
and let be two-dimensional vectors defined as
and
Define the scalars
based on these scalars, two tests that are fully robust to weak instruments for testing - Anderson Rubin test (AR1949) and Conditional Likelihood Test (Moriera 2003)
IV with Heterogeneous Treatment Effects / LATE Theorem
binary instrument
binary treatment is potential treatment status given
potential outcomes:
heterogeneous treatment effects
Compliers: , ,
Always takers:
Never Takers :
Defiers:
A1: Independence of Instrument :
A2: Exclusion restriction :
A3: First Stage:
A4: Monotonicity / No defiers: or vice versa
Under A1-A4,
If A1:A4 are satisfied, the IV estimate is the Local Average Treatment Effect for the compliers.
So, LATE is a weighted average for people with large ; i.e. treatment effect for those whose probability of treatment is most influenced by .
IV in Randomized Trials with one-sided noncompliance. Conditional on A1:A4 holding, and . Then,
Precision for LATE Estimation
Characterising Compliers
PO Model of IV allows for heterogeneous treatment effects but does not formally identify LATE conditional on X.
extends methods by allowing the treatment inducer to be randomized conditionally on the covariates and by allowing the outcome to depend on the covariates besides the treatment intake. The paper also provided semiparametric estimations of the probability of receiving the treatment inducement, which helps to identify the treatment effects in a more robust way.
Need the following assumptions (all conditional on :
Independence of instrument: : SOO w.r.t. instrument. Exclusion restriction: Monotonicity: First Stage: Common Support :
Specifically, when the treatment inducer Z is as good as randomized after conditioning on covariates X, Abadie proposed a two-stage procedure to estimate treatment effects.
Estimate the probability of receiving the treatment inducement (preferably using a semiparametric estimator) in order to provide a set of pseudo-weights.
Second, the pseudo-weights are used to estimate the local average response function (LARF) of the outcome conditional on the treatment and covariates.
The estimated coefficient for the treatment intake D reflects the conditional treatment effect.
Given monotonicity, we can identify the proportion of compliers, never-takers, and always-takers respectively.
If nobody in the treatment group has access to the treatment (i.e. ), the .
By Bayes rule,
Suppose assumptions of LATE thm hold conditional on covariates . Let be any measurable real function of with finite expectation. We can show that the expectation of is a weighted sum of the expectation in the three groups
Rearranging terms gives us
Then,
where
This result can be applied to any characteristic or outcome and get its mean for compliers by removing the means for never and always takers. [p 181-183] provides overview of estimation. Trick is to construct a weighting scheme with positive weights so that , which is negative for always-takers and never-takers.
To compute , we need , which can be computed using a standard logit/probit or a power-series.
Standard example: average covariate value among compliers:
is the weighted average of covariate using Kappa weights.
Likelihood that Complier has a given value of (Bernoulli distributed) characteristic X relative to the rest of the population is given by
Assume A1-A4 from LATE. Generalise to take values in the set; Let denote the potential (or latent) outcome for person for treatment level . Then,
where the weights
are non-negative and sum to 1.
CEF of for the subpopulation of compliers:
Estimate
Estimate in the whole population, weighting by
implemented in LARF::larf in R.
Treatment is . First define two additional quantities
is the conditional probability that unit is either a complier *or* an always taker assume that this probability is a function of covariates , with corresponding parameter vector and CDF that transforms it to the probability scale [taken to be the normal CDF henceforth, but can be relaxed] is the conditional probability that unit is an always taker *conditional* on being either a complier or a never taker assume that this probability is a function of covariates with corresponding covariate vector
Next, they note that the probability of treatment for stratum can be written as
Using the two conditional probabilties defined above, this can be written as
which, for binary treatment lets us write a Bernoulli likelihood for an observation
Plugging in the definitions of and gives us the likelihood and its argmax defines the solution for and . This is generically a difficult optimisation problem and improving its computation is a promising avenue for future research.
The maximum likelihood estimates of the two parameter vectors can be plugged into to compute individual compliance scores
The inverse compliance score weighted estimator for the ATE with weights is then
which is a weighted version of the familiar Wald estimator with a Hajek correction that normalises each expectation by the sum of weights in that treatment group.
Shift Share / Bartik Instruments
SSIV setting from [notation and exposition from PGP’s slides]. We want to estimate the causal effect or structural parameter in
where because the ‘treatment’ is typically a change in an economic quantity (e.g. employment) that is correlated with unobserved shocks to the outcome (e.g. wages). indexes locations.
An accounting identity that decomposes the treatment is
where indexes industries. 2nd accounting identity for location-industry shifts is
As a GMM system
denotes exogenous controls and fixed effects.
Under constant , need Exogeneity Relevance
‘shares’: focus on : Analogy to DiD: Changes in industry composition ‘shifts’: focus on : requires argument for why shocks are randomly assigned
with Rotemberg weight
Marginal Treatment Effects: Treatment effects under self selection
propose the marginal treatment effect (MTE) setup that generalises the IV approach for continuous instruments and nests many estimands (and is a generalisation of the Roy (1951) model). It also has a clearer treatment of self-selection.
Exposition based on . Define potential outcomes
where is the conditional mean function and captures deviations, with .
Treatment assignment assumes a weakly separable choice model
where is the latent propensity to take the treatment, and is interpreted as the net gain from treatment since treatment is only taken up if . is an instrument. enters the selection equation negatively, and thus represents latent resistance to treatment.
The condition can be rewritten as . Applying the CDF of to both sides yields
Define and .
Both RHS and LHS are distributed on . The treatment decision can now be written as
.
Now, we define treatment effects
Aggregating over different parts of the covariate distribution yields different estimates.
Integrating these over yields the conventional estimators. With self-selection based on , typically ATT > ATE > ATU.
The covariate-specific Wald estimator is
Under the standard A1-A4 from AIR96,
These can be aggregated using the ‘saturate and weight’ theorem (Angrist and Imbens)
with weights
For a continuous instrument, for a pair of instrument values , .
MTE is defined as a continuum of treatment effects along the distribution of .
Define two marginal treatment response (MTR) functions
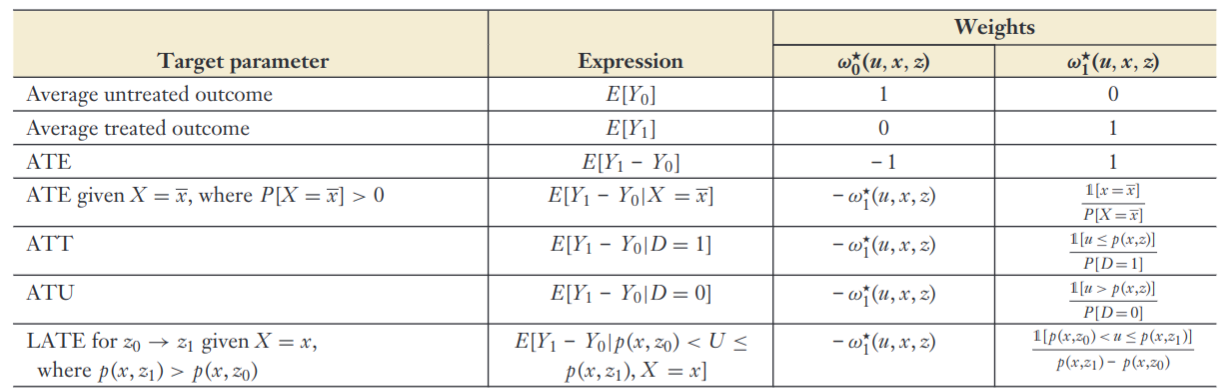
Many useful parameters are identified using the following expression
with weights specified in the figure below.
Parametric Model: Assuming joint normality for ,
where is the correlation , and .
yields MTE estimator
Let . Write
where is a random effect that captures treatment effect heterogeneity . We can rewrite this and by demeaning .
where captures the ATE at means of , which is the unconditional ATE under the linear specification.
Write the selection equation
with .
Assumptions
: Conventional selection bias.
: unobservable part of treatment effect depends linearly on the unobservables that affect treatment selection.
Including and in the control-function outcome equation yields a consistent estimate of the ATE: .
High Dimensional IV selection
setup:
where
is a vector of exogenous controls, including a constant.
is a vector of instruments
is an endogenous variable
and
Run (post)LASSO of on to obtain
Run (post)LASSO of on to get .
Run (post)LASSO of on to get .
Construct , and .
Estimate by using standard IV regression of on with as instrument. Perform inference using score statistics or conventional heteroskedasticity-robust SEs.
implemented in hdm::rlassoIV(., select.X = T, select.Z = T).
Discussion in .
Principal Stratification
Treatment comparisons often need to be adjusted for post-treatment variables.
Binary treatment . post-treatment Intermediate variable , Outcome . For each individual, the treatment assumes a single value, so only one of the two potential intermediate values are observed. Based on joint potential outcomes of the intermediate variable , we have 4 strata
Never takers.
Defiers.
Compliers.
Always takers.
The basic principal stratification w.r.t post treatment variable is the partition of units such that, forall units in any set of , all units have the same vector of . The principal stratum to which unit belongs is not affected by treatment assignment for any principal stratification, so can be considered pre-treatment.
Treatment Ignorability implies (i.e. treatment and control units can be compared conditional on stratum)
Principal Causal Effect (PCE)
A common example is the
Complier Average Causal Effect (CACE) = Causal Effect on Principal Stratum of Compliers (AIR96)
Recall that concatenated. So, AIR96 in PS terms: Monotonicity: must be empty: no defiers. Exclusion:
Estimation under principal ignorability
Treatment ignorability monotonicity: is not allowed principal ignorability
| S = 0 | S = 1 | |
|---|---|---|
| Z = 0 | G = 00 or 01 | G = 11 |
| Z = 1 | G = 00 | G = 11 or 01 |
Disentangle mixture distribution within strata by assuming same conditional expectation across mixture components (complier, never taker, always taker).
Define nuisance functions:
Treatment probability: Principal Score: identified by
where . Outcome mean: .
Treatment Probability and Principal Score
Treatment Probability and Outcome Mean
Principal Score and Outcome Mean
Direct and Indirect Effects via Principal Stratification
Direct effect of conditional on exists if there is a causal effect of on for observations for whom the treatment does not affect selection , i.e. principal strata . This is a zero-first-stage sample in IV-terms.
The Indirect Effect is mediated through .
Attrition as Selection Bias
Let denote a binary selection indicator for when is observed. Let denote potential selection states under treatment and nontreatment.
: never-selected : always selected : selection compliers : selection defiers (ruled out by Lee bounds)
Dominance assumption: and . The average potential outcome of the always selected dominates that of compliers under either treatment state.
Then, Zhang and Rubin (2003) bounds are
where is chosen such that the lowest outcomes among those with correspond to the share of compliers among those with are smaller than this value.
Assuming
randomisation: monotonicity:
Lee (2009) focuses on the ATE among the always observed
The second quantity: is point identified. In contrast, the outcome in the treatment group can be either an always-selected’s outcome or a selection complier’s outcome.
Always selected share among the treated is
In the best case, the always-selected comprise the top quantile of the treatment outcomes. Then the largest possible value of is
The smallest possible one is
this can be implemented conditional on covariates by constructing within each stratum.
Regression Discontinuity Design
Setup
Treatment () changes discontinuously at some particular value in [and nothing else does], so
Standard identification assumptions violated by definition because although unconfoundedness holds trivially since we have , this also means overlap is always violated. Need to invoke continuity to do causal inference.
Identified at , i.e. via
-
Conditional mean function is continuous at
-
Mean Treatment effect function is right continuous at
Estimators
Normalise running variable . Then, the linear regression implementation is the following:
where and are local or global polynomials. Since the design relies on identification at infinity (i.e. at the cutoff), choice of polynomial / functional form matters a lot.
Calonico, Cattaneo, Titiunik (2014) recommend local-linear regressions. Older literature relies on global higher-order polynomials, which often yields strange estimates.
Where is a kernel function. Common choices are the window function or the triangular kernel
Assumptions for Local Linear Estimator
Loosely, we need CEFs to be smooth. More precisely, we need to be twice-differentiable with uniformly bounded second derivative.
Taking a taylor expansion around , we can write the CEFs as
with . The local linear regression with a window kernel can be solved in closed form
where denote sample averages over the regression window. Then, the error term can be written as
Curvature bias is bounded by .
This rate is a consequence of working with the 2nd derivative. In general, if we assume has a bounded th derivative, we can achieve an rate using local polynomial regression of order with a bandwidth scaling as .
The local linear regression estimator for
which can be written as a local linear estimator where weights only depend on the running variable . show that local linear regression is not the best estimator in this class.
Under an assumption that , the minimax linear estimator is the one that minimises the MSE and is given by
These weights can be solved for using quadratic programming.
Fuzzy RD
Discontinuity doesn’t deterministically change treatment, but affects probability of treatment. Analogue of IV with one-sided non-compliance.
. Assuming , the probability of treatment relates to via:
where := point of discontinuity
Regression Kink Design
First-derivative version of the fuzzy RD. Continuous treatment, where the treatments are a function of the running variable with kink at . This implies that the first derivative of continuous treatment D is discontinuous at the threshold.
The marginal treatment effect at the threshold is defined as
Differences-in-Differences
DiD with 2 periods
Binary treatment , 2 time periods .
Potential outcomes denoted .
ATT in the nd period.
not observed, so must be imputed.
Naive Estimation Strategies
Before-After Comparison: $\tau = \Exp{Y_1^1 | D = 1}
- \hlblu{\Exp{Y_0^0 | D = 1}}$
assumes (No trending)
Post Treatment-Control Comparison:
Assumes (Random Assignment in the 2nd period)
Both typically untenable in practice, so we need parallel trends.
Sample analogue of
Impute with
Often justified using a figure [with transformed if necessary], or control for time trends [which relies on a strong functional form assumption], or a clear falsification test [on a placebo group].
If , this collapses to a selection-on-observables assumption in period 2.
For a two-period difference, we can also write the standard OLS exogeneity condition in differences form
Which makes a direct link with the strong exogeneity assumption in panel data models that asserts that .
Regression Estimator
We typically prefer the following regression estimator (for automatic standard errors etc).
Triple Differences (DDD) Estimator
Regular Diff-in-Diff estimate - Diff-in-diff estimate for placebo group.
Nonparametric Identification Assumptions with Covariates
Estimand:
Identification Assumptions:
SUTVA
Covariate exogeneity
No effect before treatment
Common Trend
(parallel trends within strata)
Common support
This allows us to estimate the conditional ATT as the standard DiD within each stratum.
Averaging these over gives us the ATT
where regression functions denote conditional expectations for treatment at time given covariates .
Denote potential outcomes under treatment and control for unit as and . For some observed covariates , we are interested in the CATT
For identification, we need Conditional parallel trends: Overlap: such that and
The Abadie estimand can be defined as
Defining , we then have
This is an IPW Estimator.
Integrating this over gives us the ATT
THe full IPW estimator can be written
where is the unconditional probability of being treated in the post-treatment period, and are conditional probabilities of specific treatment-group combinations.
Double-robust version - Zimmert (2020)
Panel Data
Setup: We observe a sample of cross-sectional units for time periods
One-way fixed effects and Random effects both use the form
although they make different assumptions about the error.
Error assumptions for panel regressions
(1) FE: .
(2) RE: (1) and [Absorb unobserved unit effect into error term, impose orthogonality it] . Equivalent to Pooled OLS with FGLS.
Fixed Effects Regression
Identification Assumption []
-
Strict Exogeneity - errors are uncorrelated with lags and leads of x
Equivalent statement for is
- Rules out feedback loops i.e. correlated with because s are set in response to prior error, e.g. Policing and crime.
-
regressors vary over time for at least some .
Setup[]
Define an individual fixed effect for individual
and define the same for each time period for panel data.
If is as good as randomly assigned conditional on :
Then, assuming enter linearly,
Assuming the causal effect of the treatment is additive and constant,
where is the causal effect of interest.
Then, we can write:
Restrictions
-
Linear
-
Additive functional form
-
Variation in , over time, for , must be as good as random
Estimate the specification
where individual demeaned values from pre-multiplying by the Individual specific demeaning operator with every component in the general model above, which removes the fixed effect .
Lag the general model one period and subtracting gives
where and so on. This naturally eliminates the time-invariant fixed effect . The pooled OLS estimation of in the above regression is called the first differences (FD) estimator .
FE estimator is more efficient under the assumption that are serially uncorrelated []
FD more efficient when follows a random-walk.
For Individual Fixed Effects/Within estimation, using the regression anatomy formula, write:
Since , and
Random Effects
Identification Assumption []
Assume - strong assumption
In other words, entire error term is independent of . This assumes OLS is consistent but inefficient, which is why it is of limited use in observational settings.
When there is autocorrelation in time series (i.e. s are correlated over time ), GLS estimates can be obtained by estimating OLS on quasi-differenced data. This allows us to estimate the effects of time-invariant characteristics (assuming the independence condition is met).
where
Idiosyncratic errors have constant finite variance:
Idiosyncratic errors are serially uncorrelated: .
Under these assumptions, the FGLS matrix takes a special form
where is a matrix of s. Estimators for the variance components are in [c 10, pp 260-61]. A robust estimator of is constructed using pooled OLS residuals
With this, we can apply the FGLS estimator
Hausman Test: Choosing between FE and RE
is assumed to be consistent. Oft-abused test as a result.
-
H0:
-
H0:
If the error component is correlated with , RE estimates are not consistent. Perform Hausman test for random vs fixed effects (where under the null, )
-
When the idiosyncratic error variance is large relative to , and . In words, the individual effect is relatively small, so Pooled OLS is suitable.
-
When the idiosyncratic error variance is small relative to , and . Individual effects are relatively large, so FE is suitable.
Time Trends
Linear Time Trend[]
Time Fixed Effects (a.k.a. Two-way Fixed Effects)[]
Unit Specific Time Trends[]
Distributed Lag
Define switching indicator as 1 if switched from control to treatment between and .
where the sums on the RHS allow for m lags / post-treatment effects, and q leads / pre-treatment effects. Leads should be close to 0.
Staggered Adoption
Let denote multiple time periods such that , with nobody treated at and staggered adoption. Let be a dummy that is equal to one if a subject experiences treatment introduction in period (e.g. implies the treatment is introduced in period in said group).
Under parallel trends for the untreated potential outcomes, , the treatment effect in the vanilla two-way fixed effects regression
can be decomposed as
where .
The weights sum to one and are proportional to and the same sign as
where is the average treatment of group across periods (share of periods treated), is the average treatment at period across groups, and is the grand mean of the treatment indicator. These weights can be negative.
This means that is biased for the ATT because is in not (only) proportional to . is only unbiased when
the treatment is binary AND the treatment is staggered and absorbing (i.e. groups get treated once and stay treated) AND there is no variation in treatment timing
Under these conditions, the pesky weight is constant across treated units, so the weights are proportional to .
OR, is also unbiased if is uncorrelated with the treatment effects . This is only plausible when treatment has been randomly staggered, otherwise, it is entirely plausible that groups with larger treatment effects selected into treatment early, and so on.
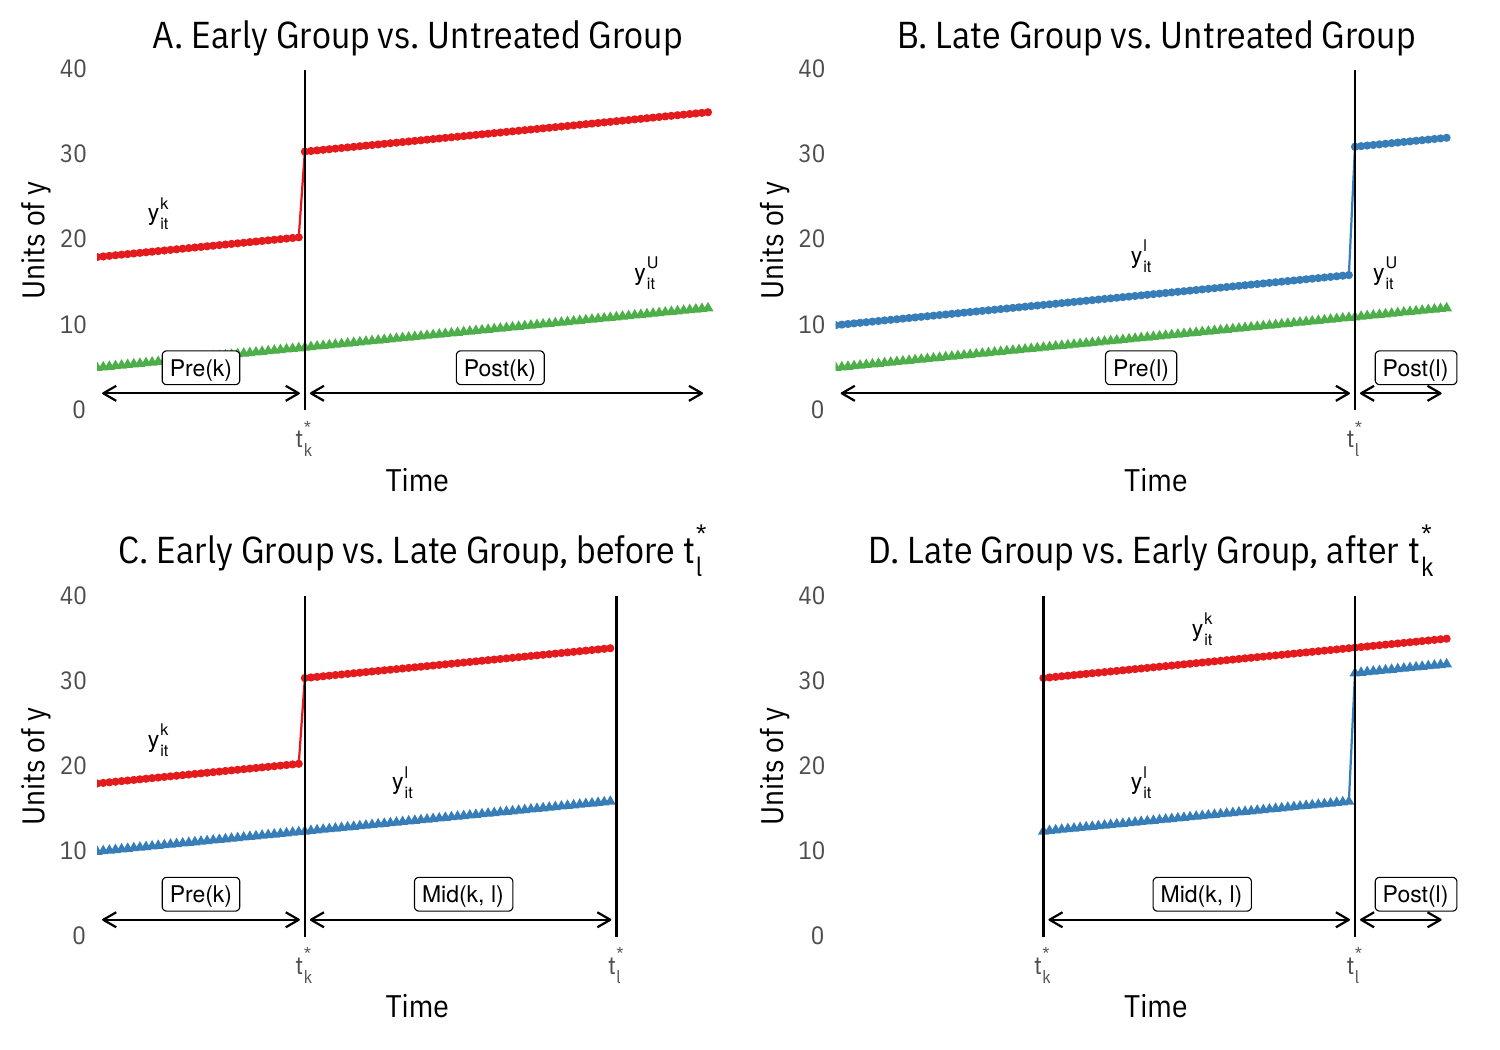
Consider a dataset comprising timing groups ordered by the time at which they first receive treatment and a maximum of one never-treated group . The OLS estimate from a two-way fixed effects regression is
where weights depend on sample size and variance of treatment within each DD. This maximises the weights of groups treated in the middle of the panel. The Late vs Early comparison is particularly problematic (and is typically incorrect when treatment effects are heterogeneous in time).
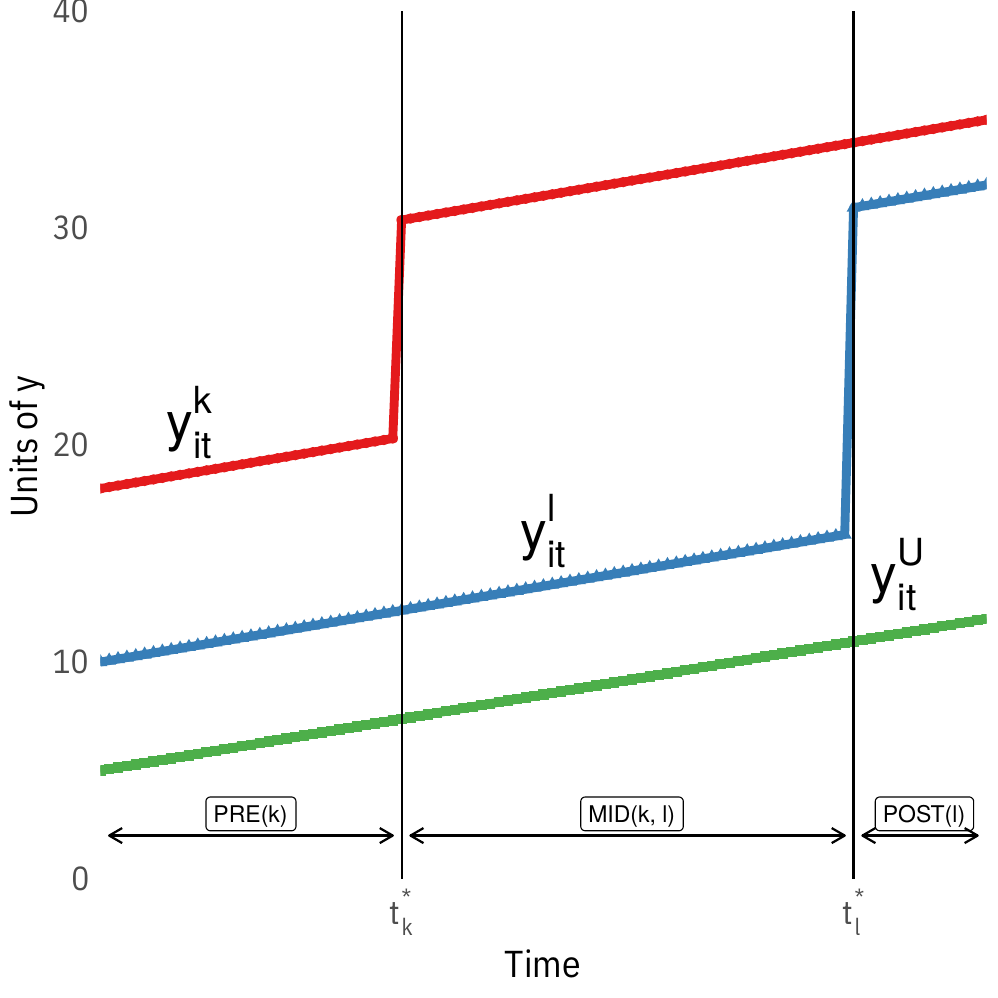
Visually, this involves decomposing the setup in the first figure below into its constituent two-way parts in the second figure.
Estimand: Group-time average treatment effect
where is the potential outcome for group treated at .
Separate (1) identification, (2) estimation and inference, and (3) aggregation.
A1: No anticipation ,
A2: Parallel trends based on ‘never treated’ group: , s.t. ,
Estimators for Group-time ATEs
Aggregation: event-study type estimand.
Implemented in did and DRDID.
The negative weighting problem with 2WFE under staggered adoption can be remedied easily by using the following procedure, which is termed Imputation by . This nests the procedures in etc.
Fit a model for using only untreated observations for all units (i.e. untreated periods for units that eventually got treated) Impute for treated units and treated time periods compute Average for (equal weighting) ATT or average over time for event study
This works well when the outcome model for is good, i.e. when the fixed effects or latent factors are well estimated. This will not work well for short panels.
Changes-in-Changes
Given a continuous outcome and a monotonicity in unobserved heterogeneity, CiC allows us to identify both the ATT and Quantile effect on the treated (QTT).
Assume the following about untreated potential outcomes
where is a scalar unobservable or an index of unobservables. is a general function assumed to be strictly monotonically increasing in values of for periods . The conditional independence assumption requires that the unobserved heterogeneity is constant over time within treatment groups.
Denote the conditional CDF of potential outcome , and corresponding CDF for observed outcome. Conditional outcome distributions are observed. The inverse of the latter is , the conditional quantile function. The unobserved CDF is identified as
The QTT at quantile is then identified as
and the ATT is identified as
Implemented in qte::CiC.
Synthetic Control
Original setup.
Observe units in periods . Unit 1 is treated starting from period , while are never treated, and are therefore called the donor pool.
Since there is only 1 treated unit, the effect of interest
Observed data matrix ()
FPCI applies; potential outcome matrices are:
Let be a vector of a pre-intervention characteristics, and is a matrix containing the same values for control units. This typically includes pre-treatment outcomes, in which case , but predictors (even time invariant ones, ) are usually available.
For some PSD matrix , define , where is typically diagonal. Consider weights satisfying
This forces interpolation, i.e. the counterfactual cannot take a value greater than the maximal value or smaller than the minimal value of for a control unit. The synthetic control solution solves
The Synthetic Control Estimator is then
In contrast, a simple difference-in-differences estimator gives
choose using a nested-minimisation of the Mean Square Prediction Error (MSPE) over the pre-treatment period
Setup:
relative magnitudes of and might dictate whether we impute the missing potential outcome using or comparison
Many Units and Multiple Periods: , is ‘fat’, and comparison becomes challenging relative to . So matching methods are attractive.
, is ‘tall’, and matching becomes infeasible. So it might be easier to estimate dependence structure.
Finally, if , regularization strategy for limiting the number of control units that enter into the estimation of may be important
Focus on last period for now:
Many estimators impute with the linear structure
Methods differ in how and are chosen as a function of
Impose four constraints
No Intercept: . Stronger than Parallel trends in DiD.
Adding up : . Common to DiD, SC.
Non-negativity: . Ensures uniqueness via ‘coarse’ regularisation + precision control. Negative weights may improve out-of-sample prediction.
Constant Weights:
DiD imposes 2-4.
ADH(2010, 2014) impose 1-3
1 + 2 imply ‘No Extrapolation’.
Relaxing these assumptions:
Negative weights
If treated units are outliers on important covariates, negative weights might improve fit
Bias reduction - negative weights increase bias-reduction rate
When , (1-3) alone might not result in a unique solution. Choose by
Matching on pre-treatment outcomes : one good control unit is better than synthetic one comprised of disparate units
Constant weights - implicit in DiD
Given many pairs of
prefer values s.t. synthetic control unit is similar to treated units in terms of lagged outcomes
low dispersion of weights
few control units with non-zero weights
Optimisation Problem
Ingredients of objective function Balance: difference between pre-treatment outcomes for treated and linear-combination of pre-treatment outcomes for control Sparse and small weights: sparsity : magnitude:
Tailored Regularisation
don’t want to scale covariates to preserve interpretability of weights. Instead, treat each control unit as a ‘pseudo-treated’ unit and compute
where
pick the value of the tuning parameters that minimises
Difference in Differences
assume (2-4) No unique solution for , so fix
Best Subset; One-to-one Matching
with (=1 for OtO)
Synthetic Control
assume (1-3) (i.e. ) For PSD diagonal matrix
Constrained regression: When (Lagged Outcomes only) and
Consider a balanced panel with units and time periods, where the first units are never treated, while treated units are exposed after time . We seek to solve for sdid weights that align pre-exposure trends in outcomes of unexposed units with those for exposed units
we also look for time weights that balance pre-exposure time periods with post-exposure time periods for unexposed units.
Weights are solved using the following optimisation problems
where denotes the positive real line. We set the regularization parameter as
We implement this for the time weights by solving
Compute regularisation parameter . Compute unit weights . Compute time weights . Compute the SDID estimator using the following weighted DID regression.
implemented in synthdid::synthdid_estimate
Where is the treatment, is the heterogeneous treatment effect for unit at time , is a vector of time-varying controls. is a vector of unknown common factors, is a vector of unknown factor loadings. This factor component nests standard functional forms
unit FEs
time FEs
two-way FEs.
Unit-specific linear time trends
Lagged dependent variable
Steps
Get initial value of using within estimator
Estimate using
Re-estimate using
Iterate
Drawback - constant effect
With, control units and treated units, Write DGP for individual unit as
Where , , is , is .
Stack controls together gives
GSC for treatment effects is an out-of-sample prediction method: the treatment effect for unit at time is the difference between the actual outcome and its estimated counterfactual , where is imputed in three steps.
Estimate an IFE model using only the control group data and estimate
Estimate Factor loadings for each treated unit by minimising mean-squared error of the predicted treated outcome in pretreatment periods
where superscripts denote the pretreatment periods.
Calculate Treated Counterfactuals based on
Choose the number of factors by cross-validation. Implemented in gsynth.
Dynamic Treatment Effects
We may want to estimate the effects of treatment sequences (‘time-varying exposures’), as in medical settings (Robins 1986, ).
2 period example
Consider a setting with and corresponding outcomes and treatments , where the treatment takes on values , and baseline covariates and covariates at the end of the first period .
Let . Accordingly, is the potential outcome realised when treatment is set to sequence . The ATE (contrast) two distinct treatment sequences vs is
Estimating this quantity requires a sequential selection on observables assumption
Under these assumptions, dynamic treatment effects can be estimated based on nested conditional means regressions
where and denote distinct treatment sequences.
or an IPW estimator
where and are propensity scores in the two periods.
Finally, a double robust estimator is
where
are (nested) conditional mean outcomes.
If we assume that is conditionally independent of potential outcomes given pre-treatment covariates and (implying that post-treatment aren’t required to control for confounders jointly affecting the second treatment and the outcome). In this case, the second part of the first SOO assumption can be strengthened to . This simplifies
implemented in causalweight::dyntreatDML.
Generalisation to arbitrary panels
Let denote treatment status at time , and collect them into a vector for each unit to form a Treatment History . A partial treatment history up to time is denoted . Time varying covariates are arranged analogously .
Potential outcomes are defined on treatment histories and rely on the standard consistency assumption / SUTVA, which assumes that the potential outcome for the same observed history when . This generates potential outcomes for the outcome in period , which permits many hypothetical comparisons.
The estimand typically of interest the average causal effect of a treatment history
Define potential outcomes just intervening on the last periods as , which is the ‘marginal’ potential outcome if the treatment history runs its natural course up to and sets the last lags to .
This allows us to define a contemporaneous treatment effect (CET)
The step lagged effect is defined analogously
and the step response function (SRF) describes how this effect varies by time period and distance between the shift and the outcome
These effects are (clunkily) parametrised in an autoregressive distributed-lag (ADL) models of the form
with assumption . This implies the following form for potential outcomes
hence, changes in can have both a direct and indirect effect on .
This relates to linear panel models of the form
where strict exogeneity is assumed.
For every treatment history and period ,
where is a set of covariates such as .
This relates to sequential exogeneity in panel models
Under sequential ignorability, an ADL approach would be to write the outcome regression with time-varying covariates
This generates post-treatment bias because may be affected by .
Define the impulse response functions (‘blip-down’ functions) as
which is the effect of a change from to in terms of the treatment on the outcome at time , conditional on treatment history up to time .
These functions are parametrised as a function of lag length
This then allows us to construct blipped-down / demediated outcomes
Intuitively, this transformation subtracts off the effects of lags of treatment, creating an estimate of the counterfactual level of the outcome at time if the treatment had been set to for periods before . Under sequential ignorability, the transformed outcome has the same expectation as the counterfactual , and can be used to construct by modelling the relationship between and to estimate the lagged effect for . This is recursive, hence the ‘nested’.
Sequential g-estimation can be used to estimate effects. Suppose we’re interested in the contemporaneous effect and the first-lagged effect and we adopt an impulse response function for both these effects. We assume sequential ignorability conditional on . Sequential g-estimation proceeds as follows
For regress the un-transformed outcome on as in an ADL model. If this is correctly specified, we estimate the blip-down parameter (contemporaneous effect) correctly. We use to construct the one-lag blipped-down outcome This blipped-down outcome would be regressed on to estimate the next blip-down parameter (the first lagged effect) (repeat for further lags, standard error estimated via block-bootstrap)
To specify a marginal structural model, we choose a potential outcome lag length and write a model for the marginal model of those potential outcomes in terms of treatment history
for example, for a contemporaneous and two lagged effects, we write , marginalising over further lags and covariates.
The average causal effect is then
This motivates an IPW approach where weights are constructed as
where the denominator of each term is the product of the predicted probability of observing unit ‘s observed treatment status conditional on covariates that satisfy conditional ignorability. Multiplying this over time produces the probability of seeing this unit’s treatment history conditional on the past.
These weights can be used in a regression of the form
Decomposition Methods
Basic idea of decomposition
Oaxaca-Blinder Decomposition
We consider two groups, and , and an outcome , and a vector of predictors . Main question for decomposition is how much of the mean outcome difference [or another summary statistic / quantile of CDF] is accounted for by group differences in the predictors . The Oaxaca-Blinder decomposition refers to the following decompositions:
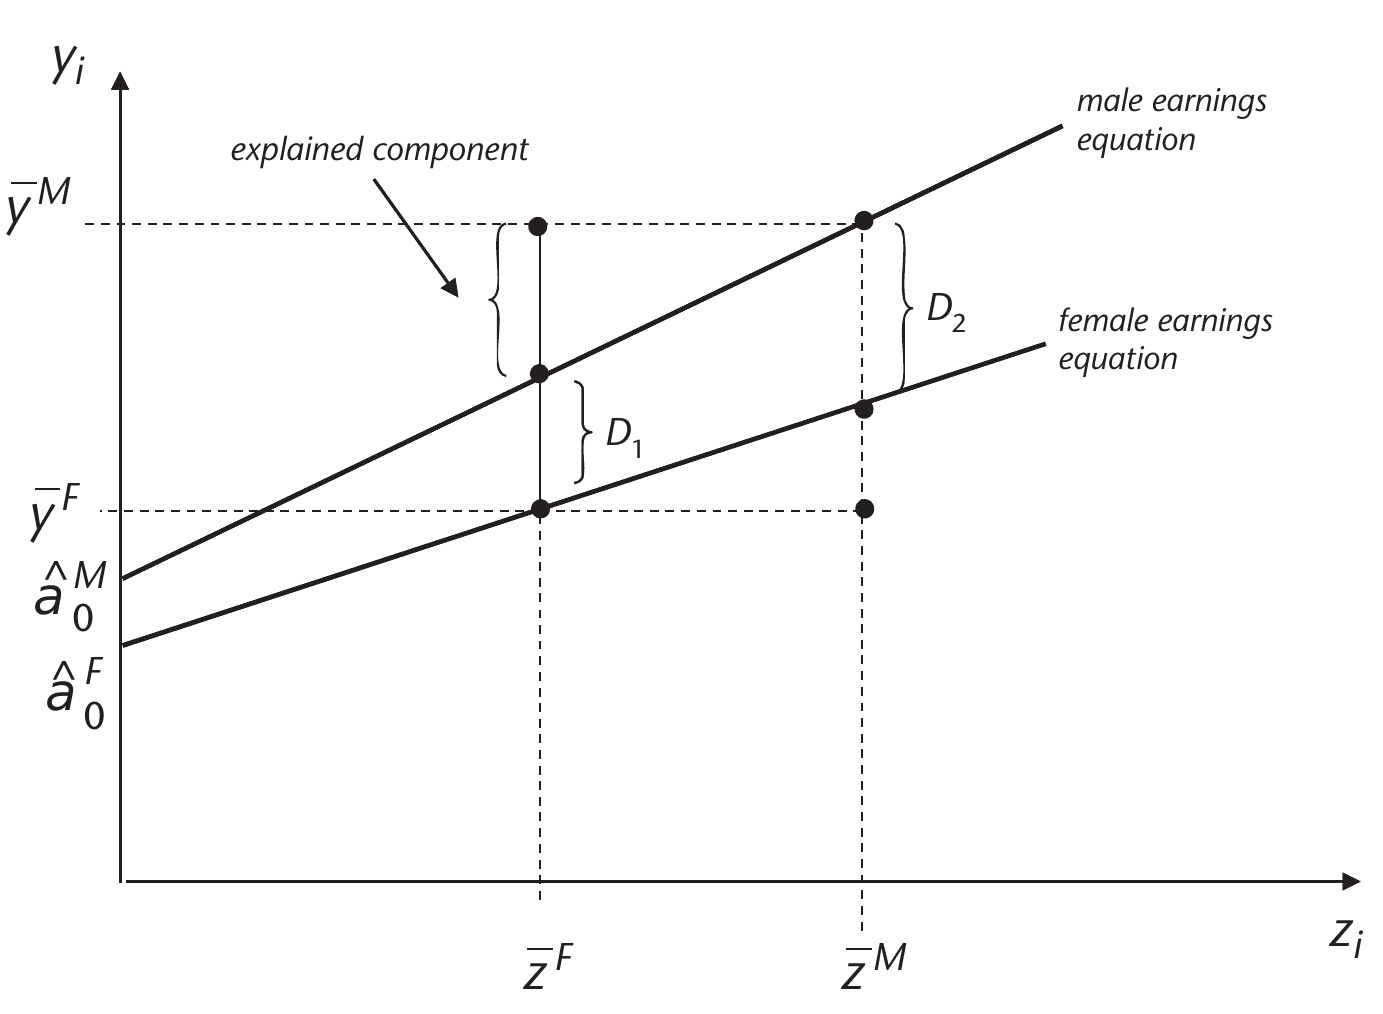
Detailed Decomposition
To examine the ‘contribution’ of each variable to the observed gap, estimate
so, is the coefficient for group , and is the coefficient for group . A t-test for is used to establish whether a variable is a source of the observed gap. The contribution of each variable to the explained part is
Let outcome models be linear and where .
The difference in means decomposition is
Sloczynski: SATT can be estimated by running the following regression:
Kline (2011) shows that this is ‘doubly robust’ and equivalent to a reweighting estimator based on the weights
where is the treated share.
Distributional Regression
Section based on counterfactual distribution decomposition methods.
Let denote the distribution of job-relevant characteristics (education, experience, etc.) for men when and for women when . Let denote the conditional distribution of wages given job-relevant characteristics for group , which describes the stochastic wage schedule that a given group faces. Using these distributions, we can construct , the distribution of wages for group facing group ‘s wage schedule as
For example, is the distribution of wages for men who face men’s wage schedule, and is the distribution of wages for women who face women’s wage schedule, which are both observed distributions. We can also study , the counterfactual distribution of wages for women if they faced the men’s wage schedule .
is the counterfactual distribution constructed by integrating the conditional distribution of wages for men with respect to the distribution of characteristics for women.
We can Interpret as the distribution of wages for women in the absence of gender discrimination, although it is predictive and cannot be interpreted as causal without further (strong) assumptions.
Assumptions for Causal Interpretation
Under conditional exogeneity / selection on observables, CE can be interpreted as causal effects. Sec 2.3 in ECTA 2013 paper spells this out in detail. Let be the vector of potential outcomes for various values of a policy , and be a vector of covariates. Let denote the random variable that describes the realised policy and let denote the realised outcome variable. When is not randomly assigned, the distribution of may differ from the distribution of . However, under conditional exogeneity, the distribution of and agree, and the observed conditional distributions have a causal interpretation, and so do counterfactual distributions generated from these conditionals by integrating out .
Let denote the distribution of the potential outcome in the population with . The causal effect of exogenously changing the policy from to on the distribution of the potential outcome in the population with the realised policy is . Under conditional exogeneity, for any , the counterfactual distribution exactly corresponds to , and hence the causal effect of exogenously changing the policy from to in the population with corresponds to the CE of changing the conditional distribution from to , that is
Conditional exogeneity assumption for this section:
groups that partition the sample. For each population and outcome . Covariate vector is observable in all populations, but the outcome is only observable in populations . Let denote the covariate distribution in the population , and and denote the conditional distribution and quantile functions in population . We denote the support of by and the region of interest by . We refer to as the reference population and as the counterfactual population.
The reference and counterfactual populations in the wage example correspond to different groups. We can also generate counterfactual populations by artificially transforming a reference population. We can think of as being created through a known transformation of :
Counterfactual distribution and quantile functions are formed by combining the conditional distribution in population with the covariate distribution in population , namely:
where and is the left-inverse function of .
The main interest lies in the quantile effect (QE) function, defined as the difference of the two counterfactual quantile functions over a set of quantile indexes
Estimation of Conditional distribution
method = "qr"default implements
where is a small constant that avoids estimation of tail quantiles, and is the quantile regression estimator
method = "logit"implements the distribution regression estimator of the conditional distribution with the logistic link function
where is the standard logistic CDF and is the distribution regression estimator
Causal Directed Acyclic Graphs
based on ,Pearl (2009), Morgan and Winship (2014), Cunningham (2020).
For an undirected graph between , there are four possible directed graphs:
(a chain)
(another chain)
(a fork on Y)
(collision on Y)
With the fork or either chain, we have . However, With a collider, .
Causal effect of on is written . Basic idea is condition on adequate controls (i.e. not every observed control). Here, controlling for is unnecessary and would bias the estimate of .
Basics / Terminology
A backdoor path is a non-causal path from to . They are ‘backdoor’ because they flow backwards out of : all of these paths point into .
Here, , where is a common cause for treatment and the outcome. So, is a confounder.
A worse problem arises with the following DAG, where dotted lines indicate that is unobserved. Because is unobserved, this backdoor path is open.
Colliders, when left alone, always close a backdoor path. Conditioning on them, however, opens a backdoor path, and yields biased estimates of the causal effect of on .
Common colliders are post-treatment controls
Another insidious type of collider is of the form , where is typically a lagged outcome.
Vector of measured controls satisfies the backdoor criterion if (i) blocks every path from to that has an arrow into (i.e. blocks the back door) and (ii) no node in is a descendant of . Then,
Which is the same as the subclassification estimator. The conditional Expectation can be computed using a nonparametric regression / ML algorithm of choice.
satisfies the frontdoor criterion if (i) blocks all directed paths from to , (ii) there are no unblocked back-door paths from to , and (iii) blocks all backdoor paths from to .
Then,
The above DAG in words
The only way influences is through , so there is no arrow bypassing between and . In other words, intercepts all directed paths from to .
Relationship between and is not confounded by unobservables - i.e. no back-door paths between A and M.
Conditional on , the relationship between and is not confounded, i.e. every backdoor path between and has to be blocked by .
With a single mediator that is not caused by , the ATE can be estimated by multiplying estimates .
The FDC estimates the ATE because it decomposes a reduced-form relationship that is not causally identified into two causally identified relationships.
Implementation through linear regressions:
Since is identified, in the first-stage equation and in the second-stage equation. Assume . Then, write
Mediation Analysis
Pearl (2001), Robins(2003)
Consider SRS where we observe , where is a treatment indicator, is a mediator, is a vector of pre-treatment controls, and is the outcome. The supports are respectively. s are partialled out.
Let denote potential value for the mediator under treatment status . The outcome is the potential outcome for unit when . The observed variables can be written as .
d, a used interchangeably for treatment.
This requires the treatment to be conditionally independent of the potential mediator states and outcomes given X, ruling out unobserved confounders jointly affecting the treatment on the one hand and the mediator and/or the outcome on the other hand conditional on the covariates. (5) postulates independence between the counterfactual outcome and mediator values ‘across-worlds’.
Effectively, Need to be randomly assigned (approx).
Difference in holding treatment status constant, and varying the mediator. Sample Average: Average Causal Mediation Effect (ACME)
Difference in holding mediator constant, and varying the treatment.
NDE conditions on potential mediator effects.For CDE, we set mediator at a prescribed value .
Difference between NDE and CDE is what value mediator is fixed at. Restated:
Effect of changing the treatment while fixing the value of the mediator at some level .
Decomposing total effect with binary mediator
Assume linear models for mediator and .
Then fit the following regressions
Baron and Kenny (1986) suggest testing . If all nulls rejected, Mediation effect . Equivalently, mediation effect is . Estimate variance using bootstrap / delta method.
Assume selection on observables w.r.t. D, M.
Huber(2014)
Average direct effect identified by
Average Indirect Effect identified by
implemented in causalweight::medweight.